Loading News...
Loading...
Loading News...

VADODARA, January 29, 2026 — Approximately 63% of Bitcoin investors currently hold their assets at an unrealized loss, according to on-chain data from Checkonchain. This Bitcoin price analysis reveals that most BTC was acquired above $88,000, creating concentrated selling pressure in the $85,000-$90,000 range. Market structure suggests a drop below $80,000 could trigger accelerated declines toward the $70,000s.
Checkonchain's UTXO Realized Price Distribution (URPD) indicator shows a high concentration of Bitcoin buyers between $85,000 and $90,000. According to the data, 63% of all invested BTC entered positions at prices of $88,000 or higher. Consequently, current prices around $87,800 place most market participants underwater. This creates what technical analysts call a "liquidity grab" zone where stop-loss orders cluster.
CoinDesk reported this analysis, warning that support between $70,000 and $80,000 appears thin. A breach of the $80,000 level could therefore lead to rapid price deterioration. The URPD metric tracks the price at which each unspent transaction output was last moved, providing a precise map of investor cost bases.
Historically, similar concentrations of underwater investors have preceded periods of heightened volatility. In contrast to the 2021 bull market where UTXO age bands showed widespread profit-taking, current data indicates accumulation at elevated levels. Underlying this trend is the post-2024 halving cycle where institutional inflows pushed prices to new highs before recent corrections.
, this mirrors patterns observed during the 2018 bear market when realized price distributions showed similar clustering above market prices. The Federal Reserve's monetary policy decisions, documented on FederalReserve.gov, continue to influence macro liquidity conditions affecting crypto markets. Related developments include JPMorgan's analysis of Bitcoin's correlation with dollar liquidity and exchange warnings during market fear periods.
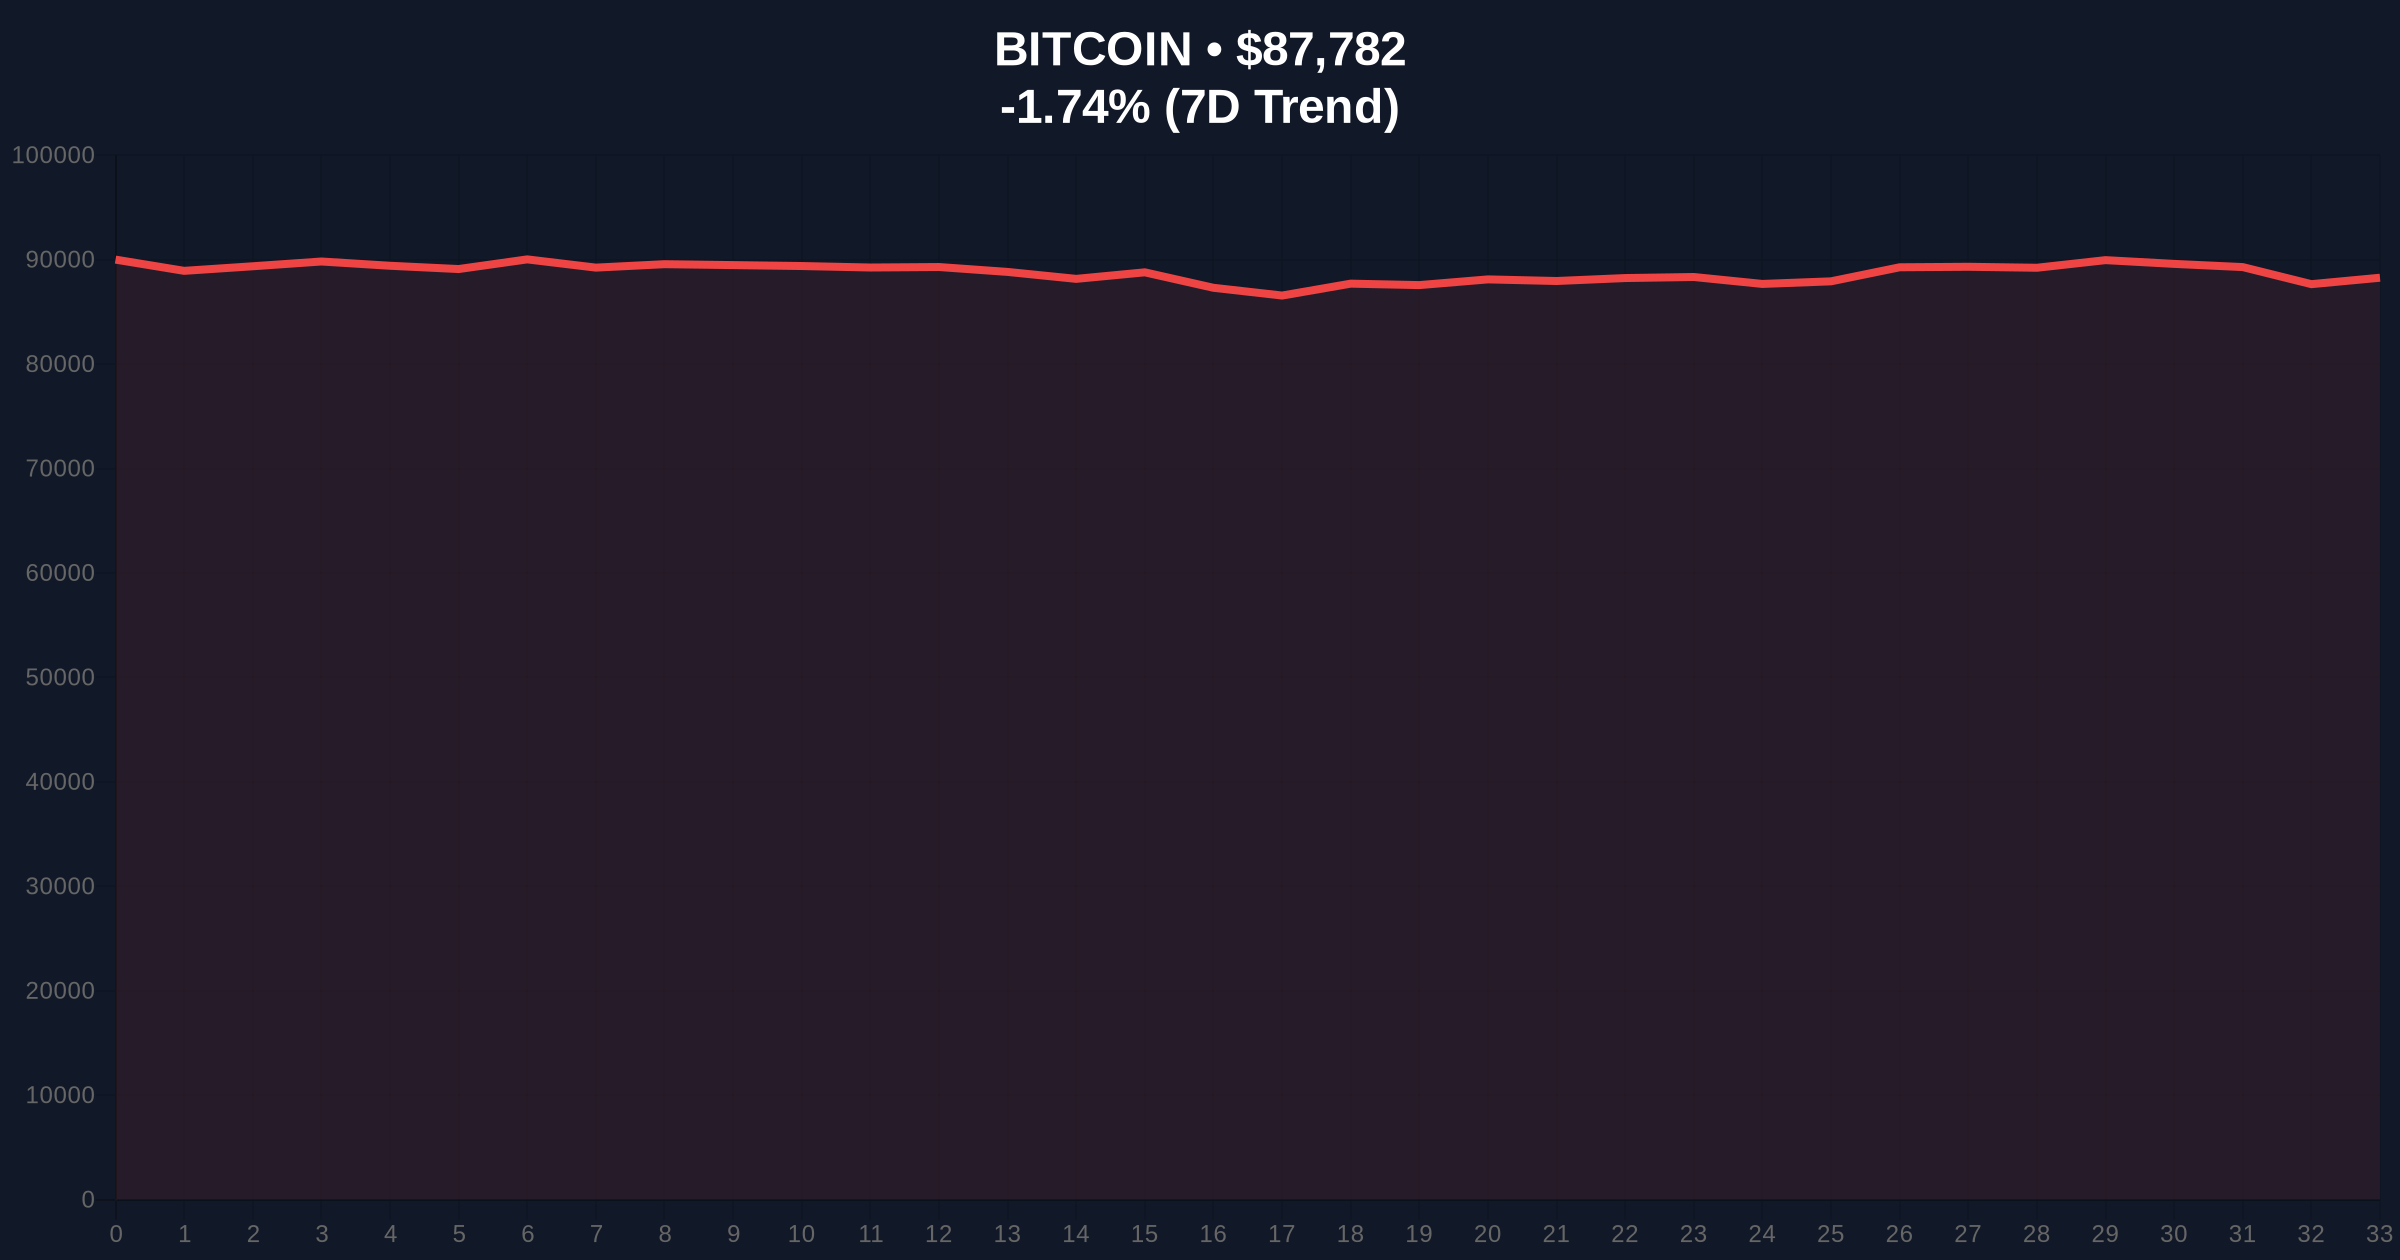
Bitcoin currently trades at $87,800, down 1.72% in 24 hours. The $80,000 level represents critical Fibonacci 0.618 support from the 2024-2025 rally. Volume profile analysis confirms light liquidity below this threshold. A break creates what technical traders identify as a "fair value gap" (FVG) targeting $72,000-$75,000.
Resistance clusters at the $90,000 psychological level where the URPD shows peak investor concentration. The 50-day moving average at $89,200 provides additional overhead resistance. RSI readings at 42 indicate neutral momentum with bearish divergence on higher timeframes. Market structure suggests this consolidation represents an "order block" that must hold to prevent further declines.
| Metric | Value | Significance |
|---|---|---|
| BTC Current Price | $87,800 | Below 63% investor cost basis |
| Investors at Loss | 63% | UTXO Realized Price Distribution data |
| Critical Support | $80,000 | Fibonacci 0.618 level |
| 24-Hour Change | -1.72% | Bearish short-term momentum |
| Crypto Fear & Greed Index | 26/100 (Fear) | Extreme fear sentiment |
This concentration of underwater investors matters because it creates potential selling pressure at specific price levels. Institutional liquidity cycles typically respond to such clusters by testing support zones. Retail market structure often breaks when too many participants share similar cost bases. Consequently, the $80,000 level becomes a liquidity fulcrum.
On-chain forensic data confirms that thin support below $80,000 could trigger cascading liquidations. Exchange heat maps show significant bid liquidity at $78,500 and $75,000, but gaps exist between these levels. This creates vulnerability to rapid moves during low-liquidity periods.
"The URPD data reveals a dangerous concentration of investors who bought near local tops. When this many market participants share similar cost bases, it creates what we call a 'gamma squeeze' scenario where minor price movements trigger disproportionate reactions. The $80,000 level isn't just psychological support—it's where the market's structural integrity gets tested."
Market structure suggests two primary scenarios based on current data:
The 12-month institutional outlook depends on whether Bitcoin holds above $80,000. Historical cycles suggest that maintaining this level through Q1 2026 could set up a second-half rally. However, a breakdown would extend consolidation through mid-2026. The 5-year horizon remains bullish due to adoption trends, but short-term volatility risks are elevated.

Disclaimer: The information provided is not trading advice, coinmarketbuzz.com holds no liability for any investments made based on the information provided on this page. We strongly recommend independent research and/or consultation with a qualified professional before making any investment decisions.
coinmarketbuzz.com leverages advanced AI technology to analyze market data. All content is fact-checked and reviewed by our editorial team to ensure accuracy and neutrality.


