Loading News...
Loading...
Loading News...

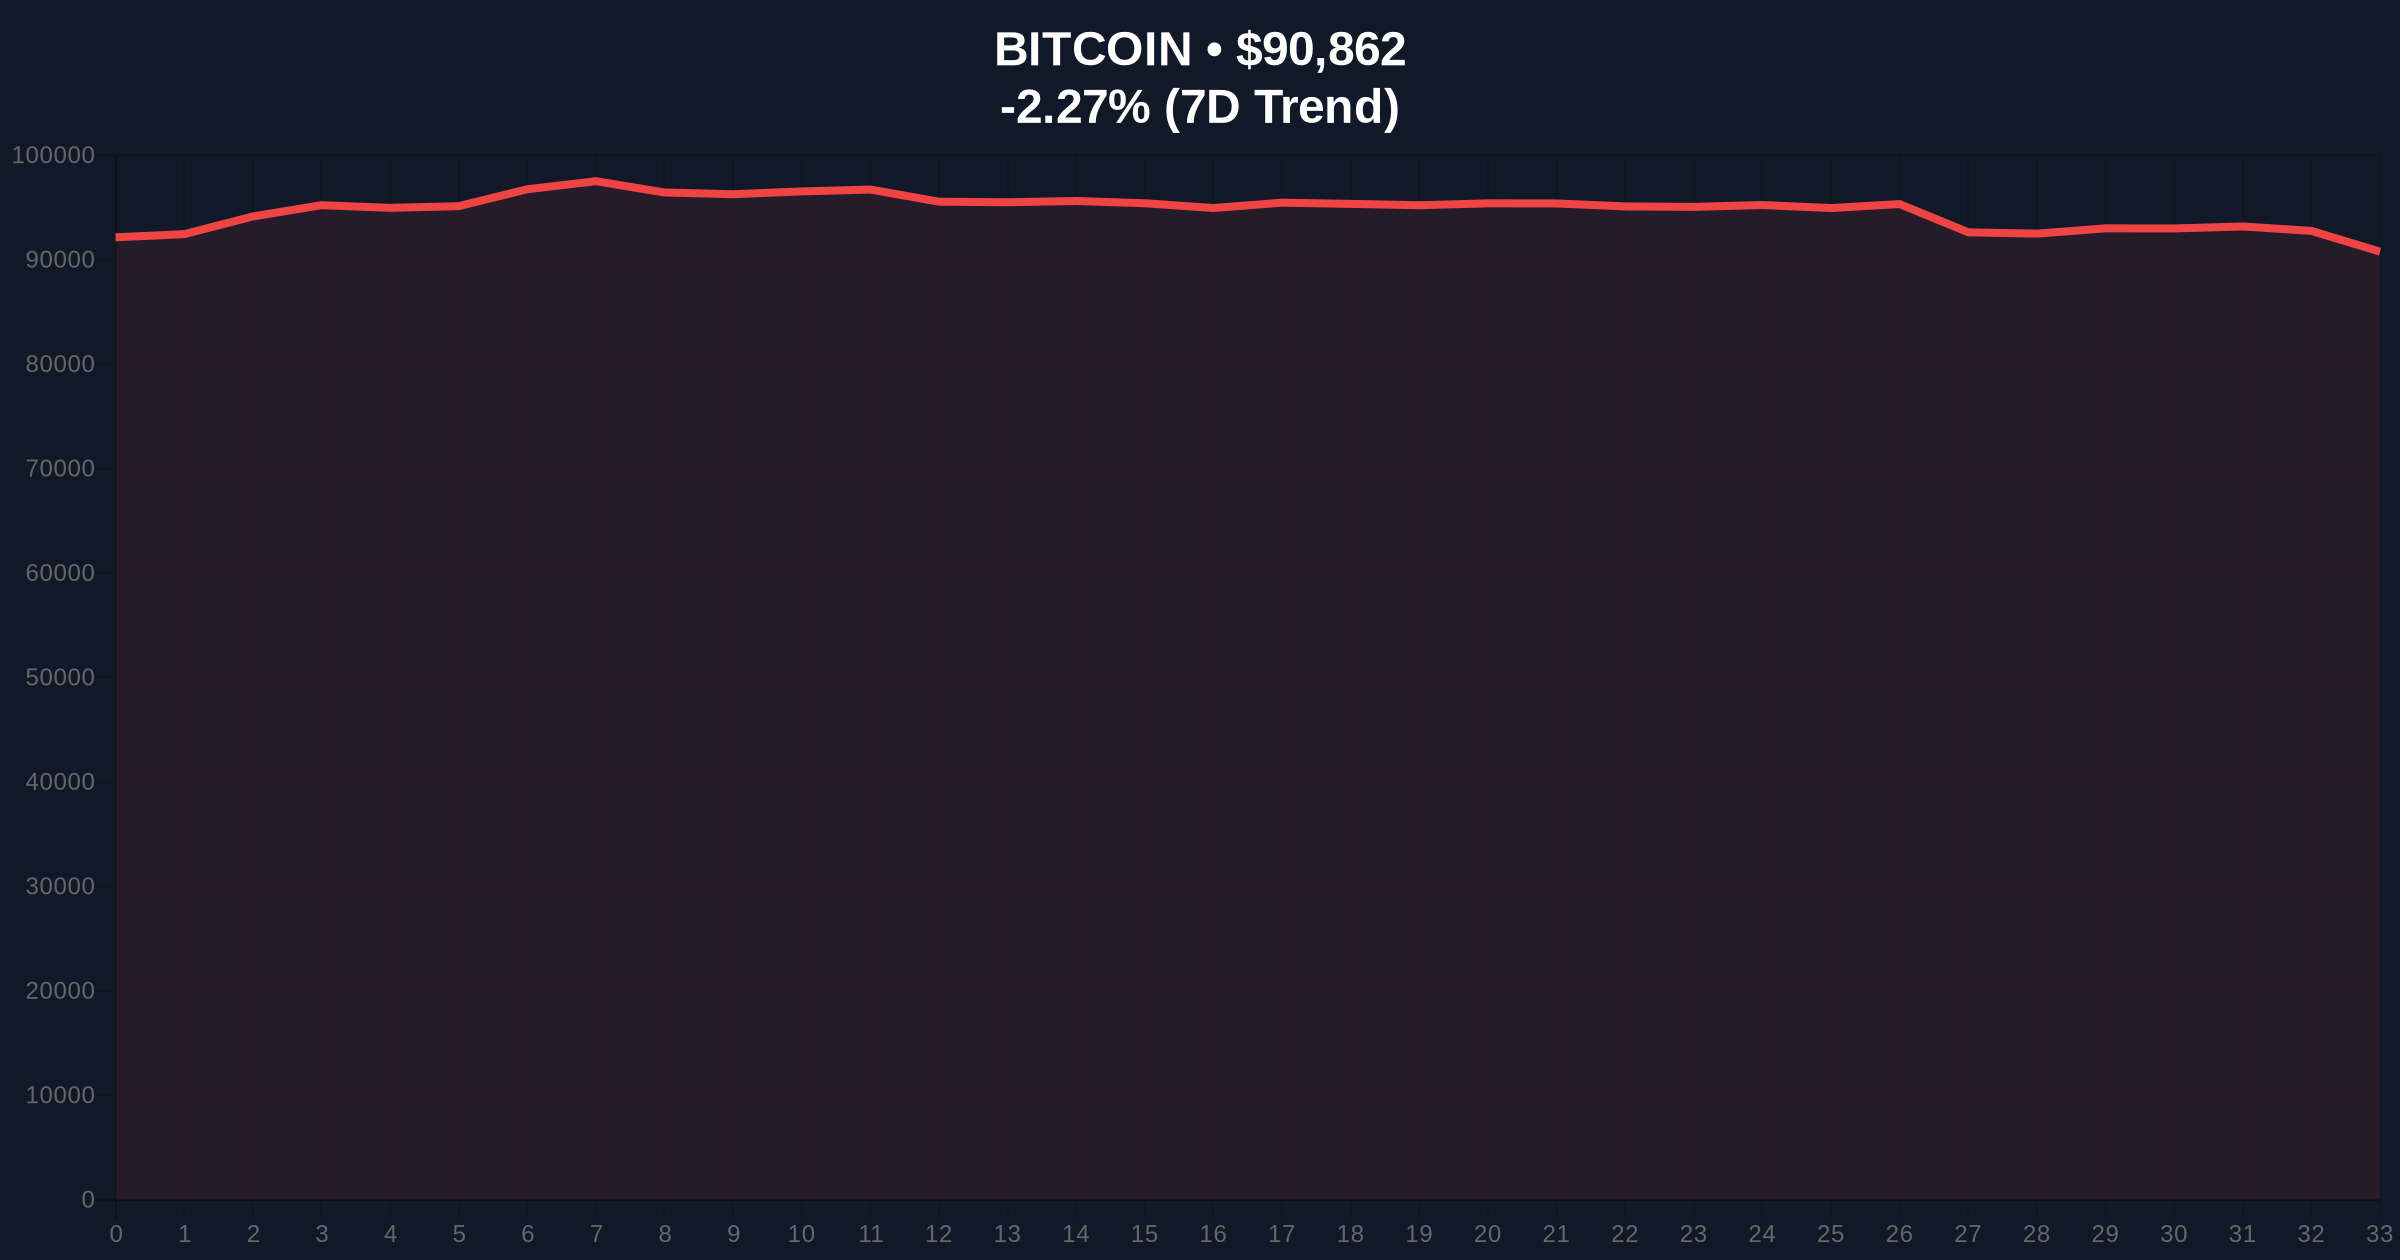
VADODARA, January 20, 2026 — Bitcoin's failure to sustain momentum above $94,000 has triggered a technical death cross, pushing the asset back into its multi-month trading range between $84,000 and $94,000. This daily crypto analysis examines whether current price action represents a liquidity grab or genuine distribution, with on-chain data indicating accumulation near the 100-week moving average at $86,000.
Bitcoin has maintained a $10,000 trading corridor for approximately 60 days, mirroring the prolonged consolidation phases observed in Q4 2023 and Q2 2025. According to historical cycles, such extended ranges typically precede volatile breakouts, with the direction determined by macro liquidity conditions and on-chain holder behavior. The current pattern resembles the 2021 cycle where Bitcoin consolidated for 14 weeks before its final parabolic move, though regulatory developments have altered market structure since then. Underlying this trend is the Federal Reserve's monetary policy stance, detailed in their official FOMC meeting calendar, which continues to influence global risk asset correlations.
On-chain forensic data confirms Bitcoin has fully retraced to its established range, with the 2026 opening price of approximately $87,000 now acting as a psychological support level. According to Cointelegraph, Daan Crypto Trades identified this zone as critical for maintaining bullish structure. Separately, Keith Alan, co-founder of Material Indicators, observed a death cross formation between the 21-week and 50-week moving averages. He noted this technical pattern has historically preceded long-term market bottoms, suggesting a potential rebound near the 100-week moving average at $86,000. Market structure suggests this convergence of technical indicators creates a high-probability order block for institutional accumulation.
The death cross formation between weekly moving averages indicates intermediate-term bearish momentum, but volume profile analysis reveals diminishing sell pressure below $88,000. The Relative Strength Index (RSI) on daily timeframes sits at 42, suggesting neutral conditions without extreme oversold readings. Critical Fibonacci support levels from the 2025 rally converge around $82,000, creating a secondary safety net below the primary $86,000 zone. A Fair Value Gap (FVG) exists between $89,500 and $91,200, representing unfinished business that price may revisit before deciding direction. Consequently, the $84,000-$94,000 range now functions as a battleground between accumulation and distribution forces.
| Metric | Value | Significance |
|---|---|---|
| Current Bitcoin Price | $90,896 | Midpoint of consolidation range |
| 24-Hour Change | -2.23% | Minor distribution pressure |
| Crypto Fear & Greed Index | 32/100 (Fear) | Capitulation sentiment present |
| 100-Week Moving Average | ~$86,000 | Primary support for rebound thesis |
| Trading Range Boundaries | $84,000 - $94,000 | 60-day consolidation corridor |
For institutional portfolios, this consolidation represents either a dangerous distribution phase or a final accumulation opportunity before the next macro cycle. The death cross pattern has historically marked exhaustion points rather than continuation signals, with 2015 and 2019 precedents showing subsequent rallies of 300%+ within 18 months. Retail traders face gamma squeeze risks in options markets where open interest clusters around $90,000 strikes, creating volatility catalysts. The prolonged range also tests Bitcoin's correlation with traditional risk assets, which has decoupled slightly since the implementation of EIP-4844 on Ethereum reduced gas fees and improved blockchain efficiency.
Market analysts on X/Twitter remain divided between accumulation and caution narratives. Bulls point to the historical reliability of death cross bottoms, arguing that "this is exactly the shakeout needed before the next leg up." Bears highlight regulatory uncertainty and point to recent developments like South Korea's exchange ownership cap exclusions as evidence of persistent structural risks. The rising Altcoin Season Index to 26 suggests some capital rotation away from Bitcoin, though dominance remains above 52%.
Bullish Case: If Bitcoin holds the 100-week moving average at $86,000 and reclaims $92,500, market structure suggests a retest of the range high at $94,000 with potential breakout toward $98,000. This scenario requires sustained on-chain accumulation and a resolution of the death cross through time rather than price appreciation. Bullish invalidation occurs below $84,000, which would indicate failed support and potential decline toward $78,000.
Bearish Case: Failure to defend $86,000 triggers a liquidity grab toward $82,000 Fibonacci support, potentially extending the consolidation phase through Q1 2026. This scenario aligns with continued Fear sentiment and could see Bitcoin test its 200-week moving average near $75,000 if macro conditions deteriorate. Bearish invalidation requires a weekly close above $94,500, which would confirm range breakout and target $100,000 psychological resistance.
Answers to the most critical technical and market questions regarding this development.

Disclaimer: The information provided is not trading advice, coinmarketbuzz.com holds no liability for any investments made based on the information provided on this page. We strongly recommend independent research and/or consultation with a qualified professional before making any investment decisions.
coinmarketbuzz.com leverages advanced AI technology to analyze market data. All content is fact-checked and reviewed by our editorial team to ensure accuracy and neutrality.