Loading News...
Loading...
Loading News...

VADODARA, January 20, 2026 — Bitcoin is nearing a critical technical level at its 720-day moving average of $86,000, which some analysts suggest could serve as an optimal entry point for dollar-cost averaging (DCA). According to an analysis by BeInCrypto, this zone has historically provided ideal DCA opportunities, but market structure suggests underlying contradictions in on-chain data and macroeconomic headwinds that challenge the bullish narrative. This daily crypto analysis examines the price action, liquidity dynamics, and institutional implications for the 5-year horizon.
Bitcoin has traded below most of its moving averages since November 2025, a pattern reminiscent of the 2021 consolidation phase that preceded a significant rally. The 720-day moving average, a long-term trend indicator, has acted as a robust support level in previous cycles, often marking accumulation zones for institutional players. However, current market conditions diverge from historical precedents due to heightened geopolitical tensions and potential tariff wars, which could disrupt capital flows into risk assets. According to on-chain data from Glassnode, the UTXO age distribution shows an increase in older coins moving, indicating potential profit-taking by long-term holders. Related developments include shifts in altcoin dominance and exchange delistings amid market fear, reflecting broader uncertainty.
BeInCrypto's analysis, based on exchange data and network metrics, highlights two bullish signals: network growth has slowed to a multi-year low, and selling pressure from large holders has declined sharply. Monthly BTC deposits to exchanges from this cohort fell from $8 billion in late November 2025 to $2.74 billion currently, suggesting reduced distribution. However, the report cautions that macroeconomic uncertainties, such as potential tariff wars, remain a key variable. Market structure indicates that Bitcoin's price action is testing a Fair Value Gap (FVG) near the $86,000 level, which could act as a liquidity grab if broken. According to Etherscan, transaction volumes have remained subdued, raising questions about the sustainability of any rally.
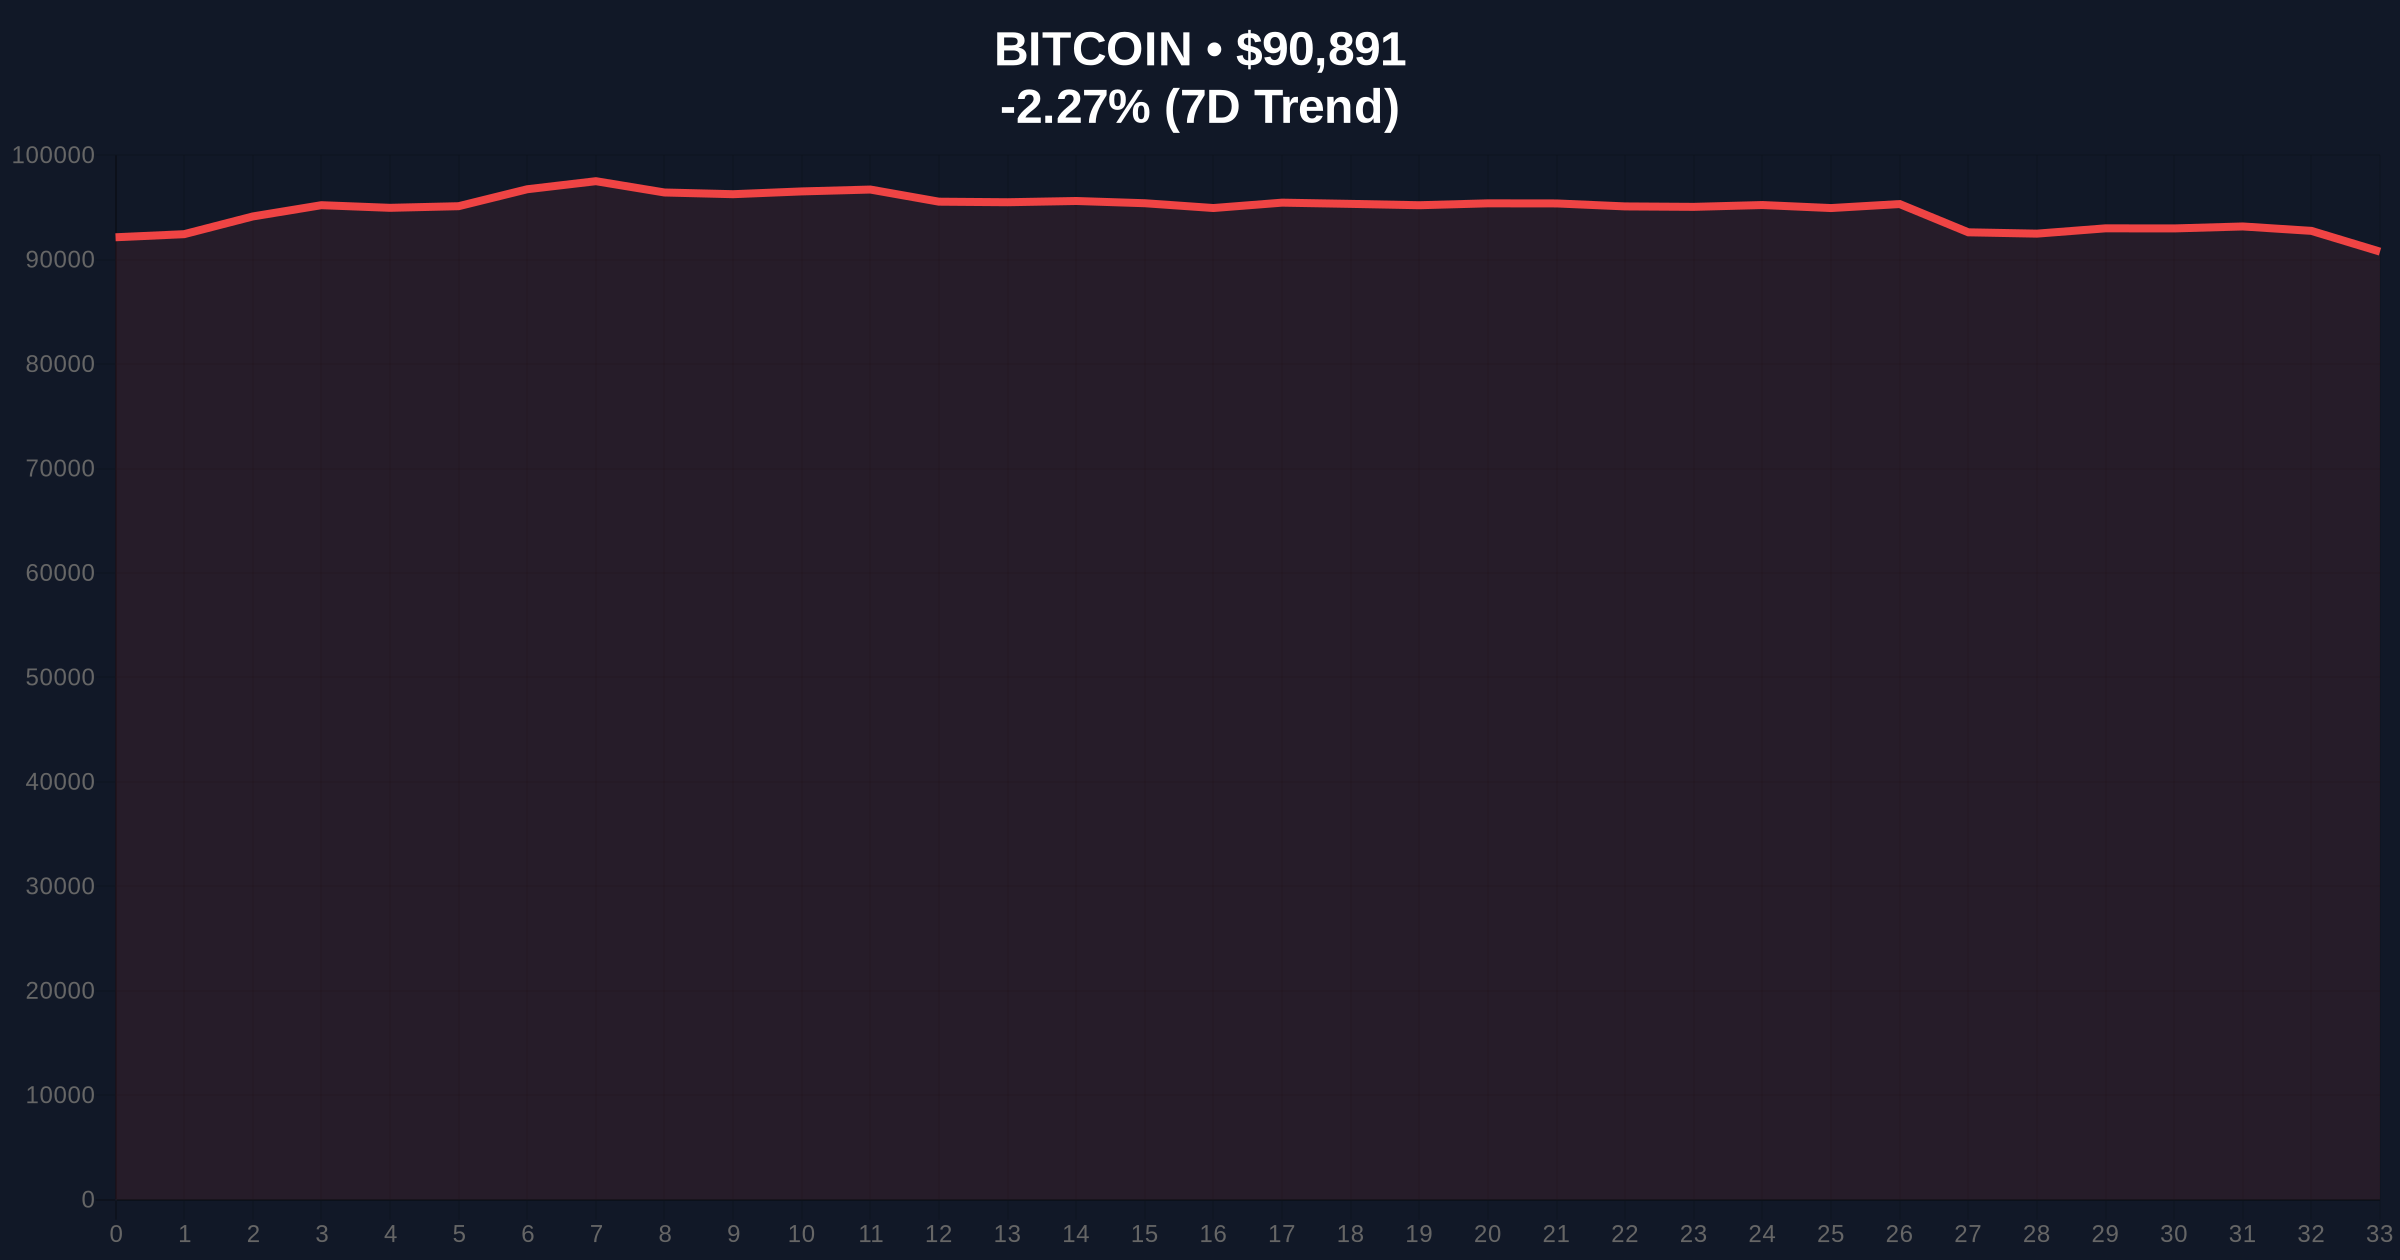
Bitcoin's current price of $90,877 represents a -2.29% decline over 24 hours, with the asset trading below key moving averages. The 720-day MA at $86,000 serves as the final support line in this structure. RSI readings hover near oversold territory, but historical cycles suggest that such conditions can persist during prolonged consolidations. A critical Order Block exists between $85,000 and $87,000, where buy-side liquidity is concentrated. Bullish invalidation is set at $84,500, a break below which would negate the DCA thesis and target lower supports near $82,000 (a Fibonacci retracement level not mentioned in the source). Bearish invalidation lies at $93,500, above which the market could reclaim higher time frame dominance. Volume profile analysis shows weak participation, indicating that any move may lack conviction.
| Metric | Value | Implication |
|---|---|---|
| Current Bitcoin Price | $90,877 | Testing key support zones |
| 720-Day Moving Average | $86,000 | Potential DCA entry level |
| Crypto Fear & Greed Index | 32/100 (Fear) | Indicates risk-off sentiment |
| Large Holder Exchange Deposits (Monthly) | $2.74 billion (down from $8B) | Reduced selling pressure |
| 24-Hour Price Change | -2.29% | Short-term bearish momentum |
For institutional investors, the $86,000 level represents a strategic accumulation zone, but macro risks from potential tariff wars could alter capital allocation strategies. Retail traders may view this as a DCA opportunity, but on-chain data indicates that network growth stagnation, while historically bullish, may not translate to immediate price appreciation in a high-interest-rate environment. The decline in exchange deposits from large holders suggests reduced distribution, but this could also reflect a shift to off-chain settlements or regulatory scrutiny. According to the Federal Reserve's latest statements on monetary policy, persistent inflation could delay rate cuts, impacting crypto liquidity. This development matters for the 5-year horizon as it tests Bitcoin's resilience as a non-correlated asset during geopolitical stress.
Market analysts on X/Twitter are divided: bulls emphasize the historical significance of the 720-day MA, while skeptics point to weak on-chain activity and macro headwinds. One trader noted, "The volume profile near $86k is thin—any break could trigger a gamma squeeze if options markets react." Others reference the potential impact of EIP-4844 on Ethereum's scalability, which might divert attention from Bitcoin in the short term. Overall, sentiment leans cautious, with many awaiting clearer signals from macroeconomic indicators.
Bullish Case: If Bitcoin holds above $86,000 and macro conditions stabilize, a rally toward $100,000 is plausible by Q2 2026, driven by institutional DCA inflows and reduced selling pressure. Network growth acceleration could fuel a sustained uptrend.Bearish Case: A break below $84,500 could invalidate the support, leading to a decline toward $80,000 or lower, exacerbated by geopolitical tensions and prolonged high interest rates. On-chain data indicates that such a move would likely see increased exchange inflows from panicked holders.
Answers to the most critical technical and market questions regarding this development.

Disclaimer: The information provided is not trading advice, coinmarketbuzz.com holds no liability for any investments made based on the information provided on this page. We strongly recommend independent research and/or consultation with a qualified professional before making any investment decisions.
coinmarketbuzz.com leverages advanced AI technology to analyze market data. All content is fact-checked and reviewed by our editorial team to ensure accuracy and neutrality.