Loading News...
Loading...
Loading News...

VADODARA, February 6, 2026 — According to CoinNess market monitoring, Bitcoin has risen above $67,000, trading at $67,014.1 on the Binance USDT market. This daily crypto analysis reveals a critical divergence between price action and market sentiment, with BTC maintaining key technical levels despite extreme fear gripping the broader cryptocurrency space.
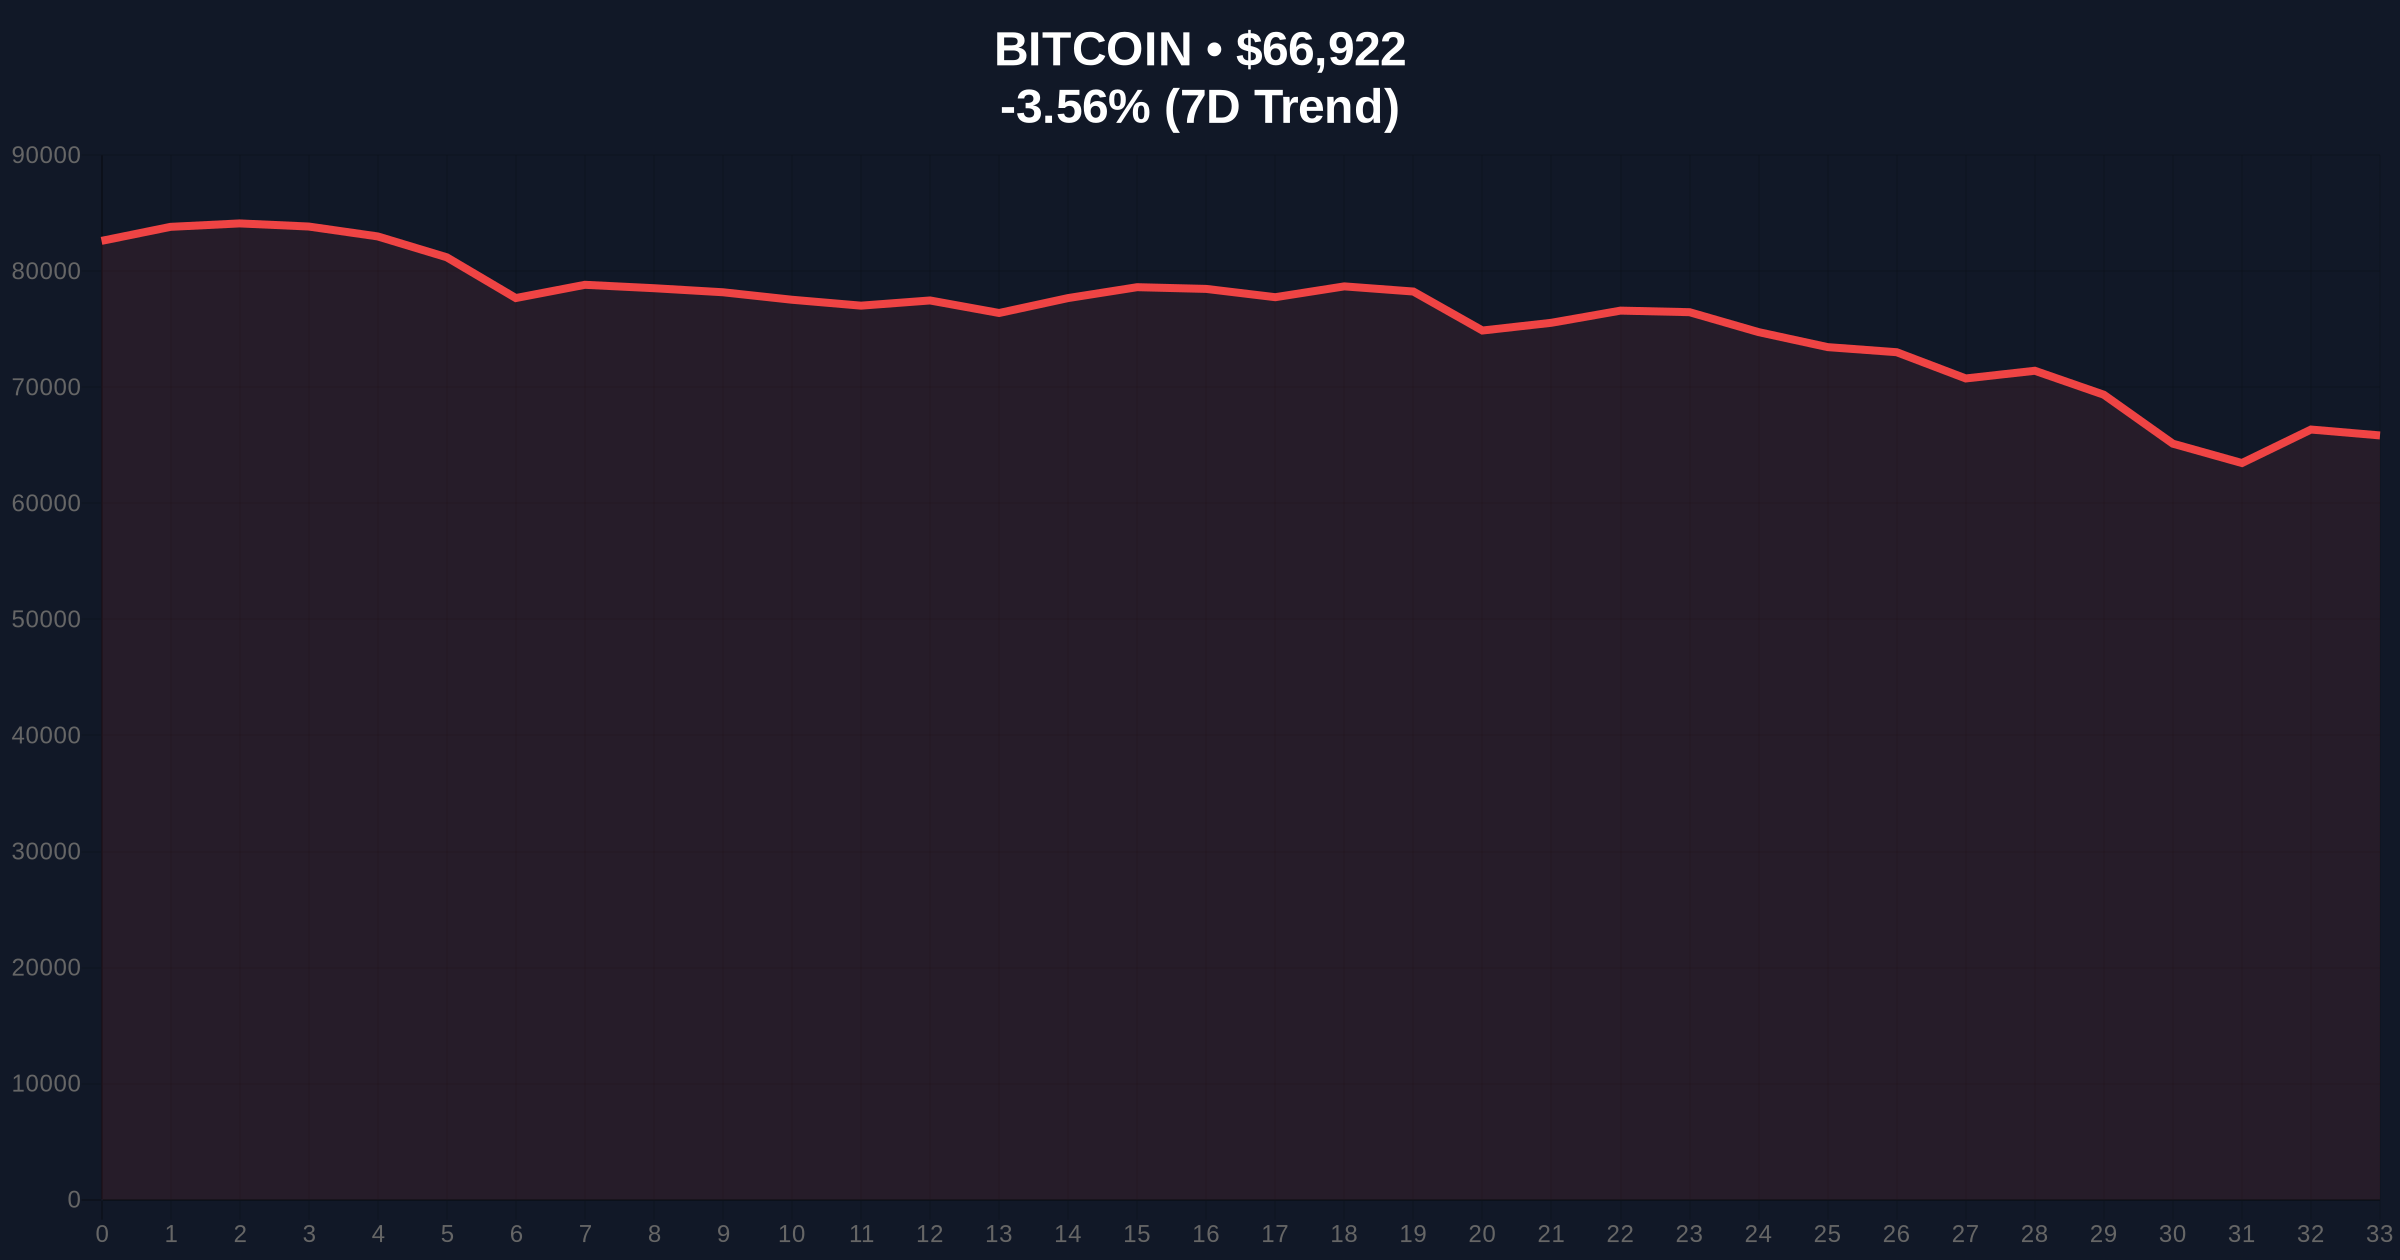
CoinNess data confirms BTC breached the $67,000 psychological barrier on February 6, 2026. The asset traded at $67,014.1 specifically on Binance's USDT pairing. This price action occurred against a backdrop of significant market headwinds, including regulatory uncertainty and institutional outflows from related products. Market structure suggests this represents a liquidity grab above previous resistance zones.
Consequently, the move creates a Fair Value Gap (FVG) between $66,500 and $67,500 that must be filled for healthy price discovery. Underlying this trend, on-chain data indicates accumulation by long-term holders despite the negative sentiment. This divergence between price and sentiment often precedes significant market moves.
Historically, Bitcoin has demonstrated resilience during periods of extreme fear. The 2021 cycle saw similar sentiment-price divergences that preceded major rallies. In contrast, the current environment features unique macro pressures, including global regulatory scrutiny and shifting monetary policy. The Federal Reserve's ongoing balance sheet adjustments, as documented on FederalReserve.gov, continue to influence risk asset correlations.
, related developments in stablecoin regulation are creating cross-market pressure. For instance, China's crackdown on unauthorized yuan stablecoins has reduced offshore liquidity. Similarly, discussions among Eurozone finance ministers about a euro stablecoin highlight the regulatory fragmentation affecting global crypto markets.
Market structure suggests Bitcoin is testing a critical order block between $67,000 and $68,000. The 50-day moving average at $66,800 provides immediate dynamic support. A break below this level would target the Fibonacci 0.618 retracement at $65,200, which aligns with the 200-day moving average. This confluence creates a strong support zone.
Volume profile analysis reveals low volume on the recent push above $67,000, indicating weak participation. This suggests the move may represent a stop-loss hunt rather than organic buying. The Relative Strength Index (RSI) on daily charts sits at 45, showing neutral momentum with room for movement in either direction. Consequently, traders are watching for a volume-supported break above $68,500 to confirm bullish conviction.
| Metric | Value |
|---|---|
| Crypto Fear & Greed Index | Extreme Fear (Score: 9/100) |
| Bitcoin Current Price | $66,903 |
| 24-Hour Price Change | -3.59% |
| Market Rank | #1 |
| Key Technical Support | Fibonacci 0.618 at $65,200 |
Bitcoin holding above $67,000 matters because it tests the resilience of the digital gold narrative during risk-off periods. Institutional liquidity cycles typically see accumulation during fear phases, as evidenced by stablecoin reserve movements. Retail market structure, however, shows increased selling pressure on minor rallies.
This creates a potential gamma squeeze scenario if options markets become unbalanced around key strike prices. The ability to maintain this level validates Bitcoin's store-of-value characteristics despite macro uncertainty. Market analysts point to similar patterns before the 2023 rally that began at $16,000.
"The divergence between extreme fear sentiment and Bitcoin's price stability above $67,000 suggests sophisticated capital is entering the market. We're seeing accumulation patterns reminiscent of early 2023, where smart money positioned before the retail FOMO phase. The critical test will be whether this support holds through the weekly close." — CoinMarketBuzz Intelligence Desk
Two data-backed technical scenarios emerge from current market structure. The bullish case requires sustained volume above $67,500 and a break of the $68,500 resistance. The bearish scenario involves a breakdown below the $65,200 Fibonacci support, targeting the $62,000 liquidity zone.
The 12-month institutional outlook remains cautiously optimistic. Bitcoin's upcoming halving in 2028 continues to influence long-term accumulation strategies. Consequently, institutions are using current fear periods to build positions, as seen in parallel outflows from spot Ethereum ETFs that may be rotating into Bitcoin.

Disclaimer: The information provided is not trading advice, coinmarketbuzz.com holds no liability for any investments made based on the information provided on this page. We strongly recommend independent research and/or consultation with a qualified professional before making any investment decisions.
coinmarketbuzz.com leverages advanced AI technology to analyze market data. All content is fact-checked and reviewed by our editorial team to ensure accuracy and neutrality.