Loading News...
Loading...
Loading News...

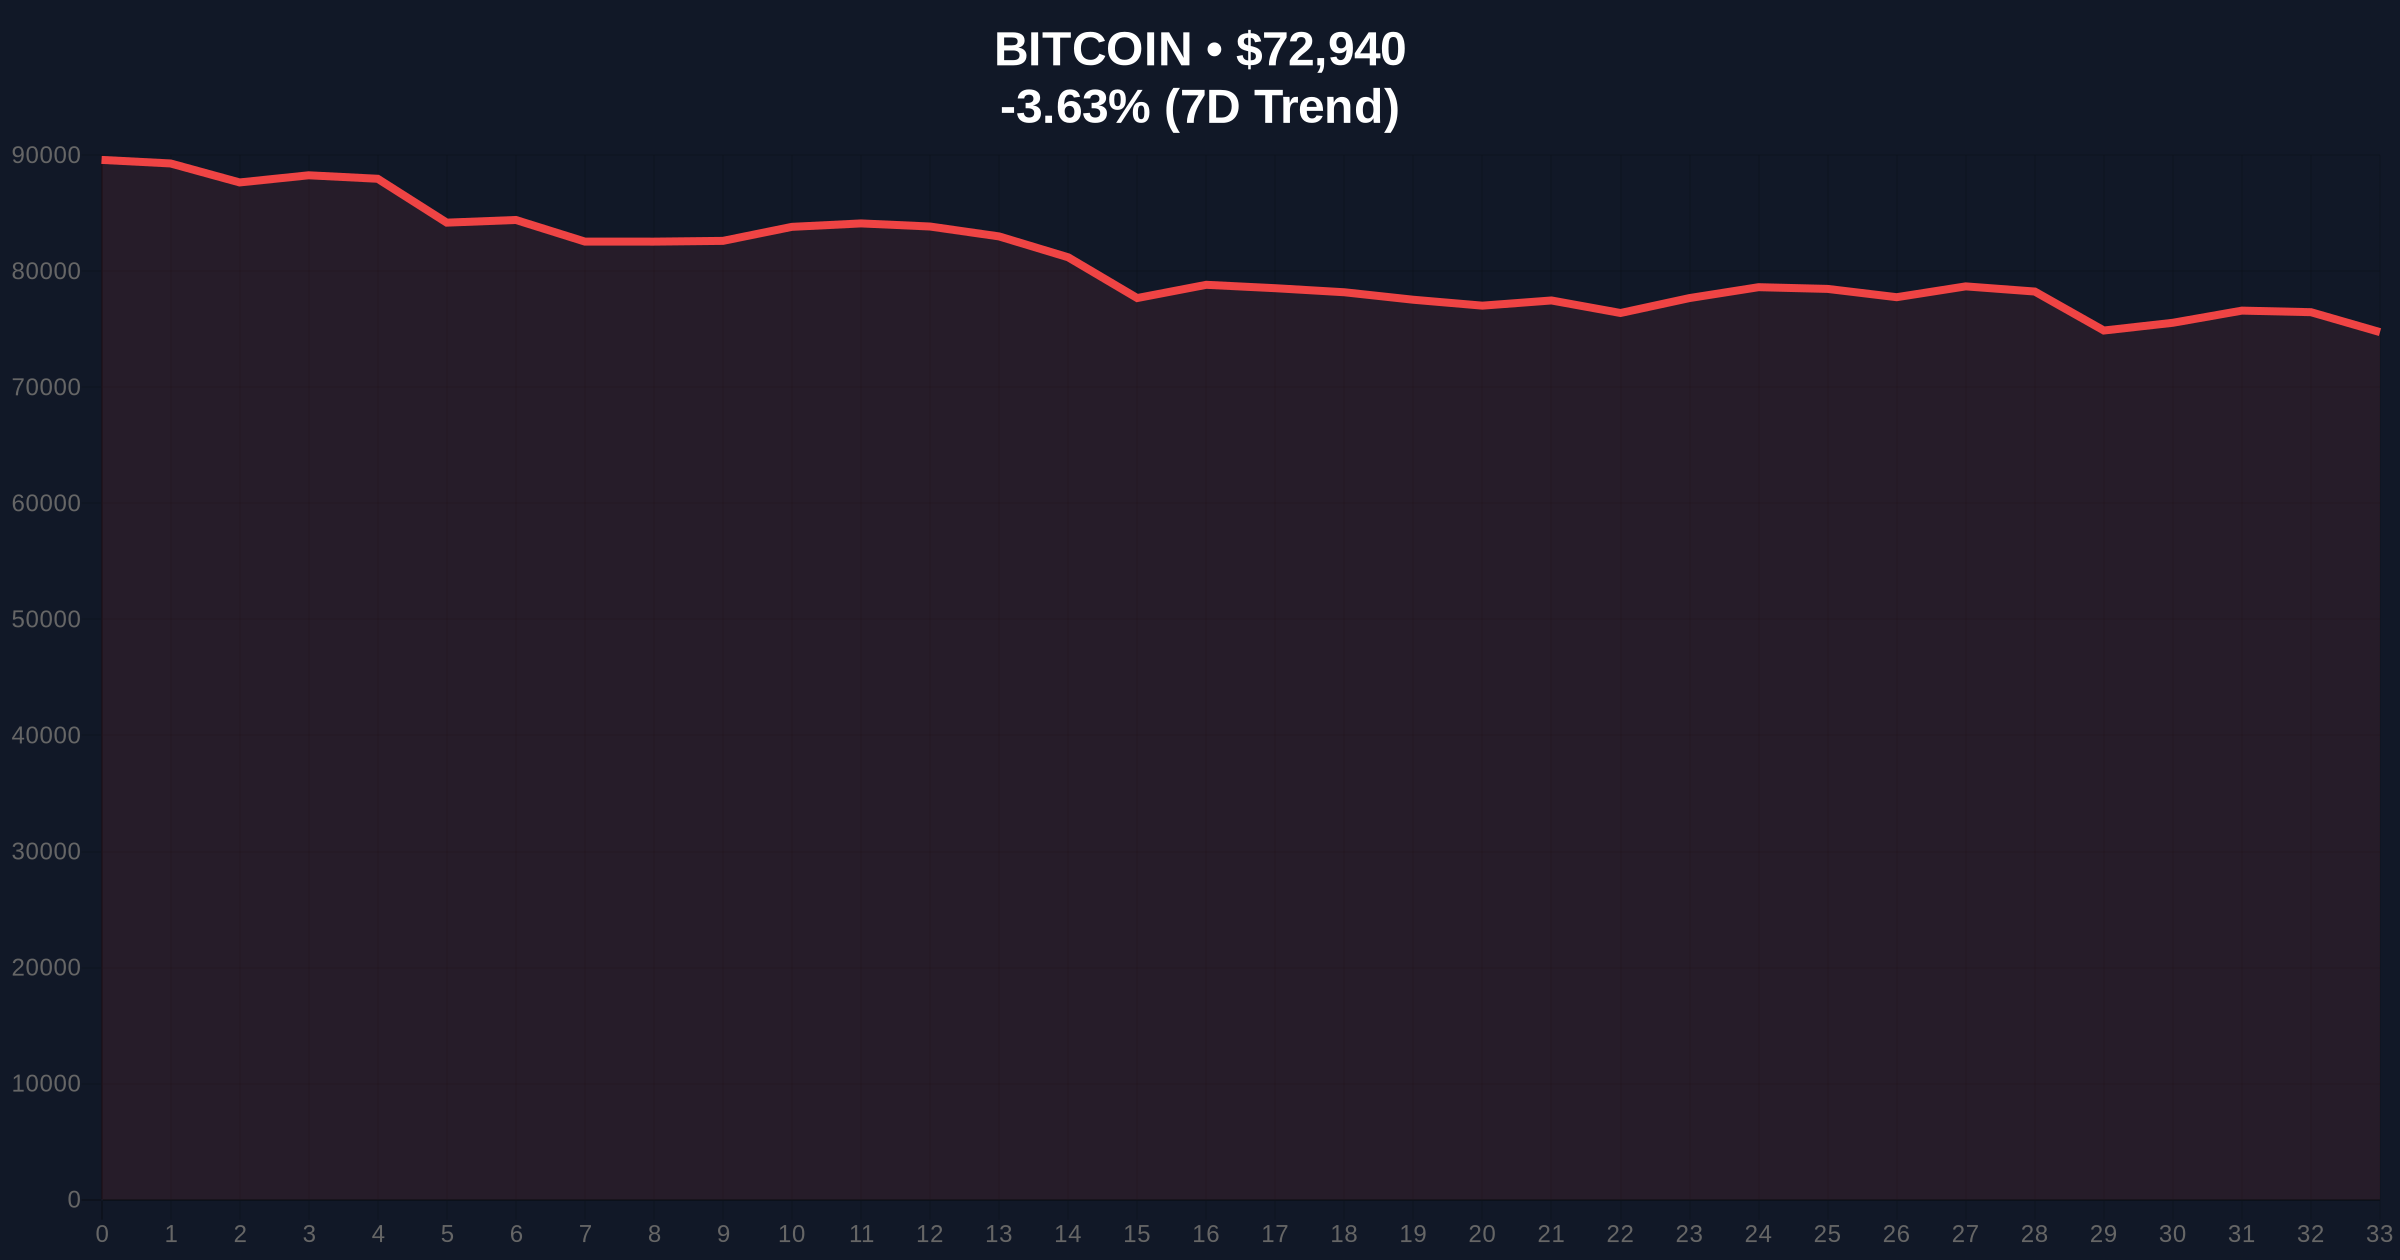
VADODARA, February 4, 2026 — Bitcoin's price action triggered a critical technical alert as it breached the $73,000 support level, trading at $72,914.98 on the Binance USDT market according to CoinNess market monitoring. This daily crypto analysis examines whether this move represents a healthy correction or the beginning of a deeper structural breakdown.
Market structure suggests a deliberate liquidity grab below the $73,000 threshold. According to CoinNess data, BTC established a local low of $72,914.98. This price action invalidated a short-term bullish order block that had formed between $73,200 and $73,500. Consequently, the market now faces a significant Fair Value Gap (FVG) that must be filled for any sustainable recovery.
Volume profile analysis indicates weak buying interest at the breakdown point. The rapid descent through $73,000 occurred on elevated but not climactic volume, suggesting this was not a panic-driven capitulation event. Instead, it points to calculated selling pressure from larger holders. This contradicts the simplistic "fear-driven selloff" narrative often promoted during such dips.
Historically, Bitcoin has experienced similar support tests during mid-cycle consolidations. The current price action mirrors the July 2024 correction that tested the $58,000 support before resuming its uptrend. In contrast to 2021's parabolic moves, the 2025-2026 cycle exhibits more institutional participation, which typically results in shallower but more prolonged corrections.
Underlying this trend is a complex regulatory backdrop. Recent developments include Republican lawmakers urging Treasury Bitcoin purchases amid market stress, while the Treasury has denied having bailout authority. , banking sector movements like BBVA joining the Qivalis consortium for a Euro stablecoin and scrutiny over WLFI's bank charter create cross-currents affecting digital asset liquidity.
The breakdown below $73,000 creates a critical technical juncture. Market structure suggests the next significant support cluster exists at the Fibonacci 0.618 retracement level of $72,000, which aligns with the 50-day exponential moving average. A breach of this level would open the path toward $70,000, where substantial UTXO (Unspent Transaction Output) accumulation occurred during the previous consolidation phase.
Relative Strength Index (RSI) readings have descended from overbought territory above 70 to currently hover near 45 on the daily timeframe. This indicates weakening momentum but not yet oversold conditions. The 200-day moving average at $68,500 provides the ultimate structural support for the bull market. According to Ethereum's official documentation on network upgrades, similar technical patterns often precede volatility in correlated assets during market stress periods.
| Metric | Value | Context |
|---|---|---|
| Crypto Fear & Greed Index | 14/100 (Extreme Fear) | Lowest sentiment reading in 3 months |
| Bitcoin Current Price | $73,094 | Post-break recovery attempt |
| 24-Hour Price Change | -3.43% | Significant single-day decline |
| Market Rank | #1 | Maintains dominance position |
| Key Support Level | $72,000 | Fibonacci 0.618 retracement |
This price action matters because it tests the institutional conviction that has supported Bitcoin's 2025 rally. On-chain data indicates that large holders (entities holding 1,000+ BTC) have been net distributors over the past week, contributing to the selling pressure. The break below $73,000 represents more than a psychological threshold—it's a liquidity event that reveals underlying market fragility.
Market structure suggests retail traders are experiencing maximum pain, with leveraged long positions facing liquidation cascades. Meanwhile, institutional players may view this as an accumulation opportunity within their longer-term frameworks. The divergence between extreme fear sentiment and Bitcoin's fundamental adoption metrics creates a potential asymmetry that sophisticated investors monitor closely.
The $73,000 breakdown represents a critical test of market structure. While sentiment indicators scream panic, on-chain metrics show controlled distribution rather than wholesale capitulation. The true test will be whether institutional buyers step in at the $72,000 Fibonacci level or if we see a deeper flush toward $70,000. Historical cycles suggest these mid-cycle corrections typically resolve bullishly, but each breakdown must be respected until proven invalid.
— CoinMarketBuzz Intelligence Desk
Market structure suggests two primary scenarios based on the $72,000 support test. The bullish case involves a successful defense of this level followed by a reclaim of $73,500 resistance. The bearish scenario sees a breakdown toward $70,000 where stronger historical support exists.
The 12-month institutional outlook remains cautiously optimistic despite near-term volatility. Market structure suggests that Bitcoin's fundamental adoption trajectory—including ETF flows and corporate treasury allocations—remains intact. However, the current price action serves as a reminder that even bull markets experience significant drawdowns. The Federal Reserve's monetary policy decisions, particularly regarding interest rates, will likely influence Bitcoin's performance throughout 2026 more than technical levels alone.

Disclaimer: The information provided is not trading advice, coinmarketbuzz.com holds no liability for any investments made based on the information provided on this page. We strongly recommend independent research and/or consultation with a qualified professional before making any investment decisions.
coinmarketbuzz.com leverages advanced AI technology to analyze market data. All content is fact-checked and reviewed by our editorial team to ensure accuracy and neutrality.