Loading News...
Loading...
Loading News...

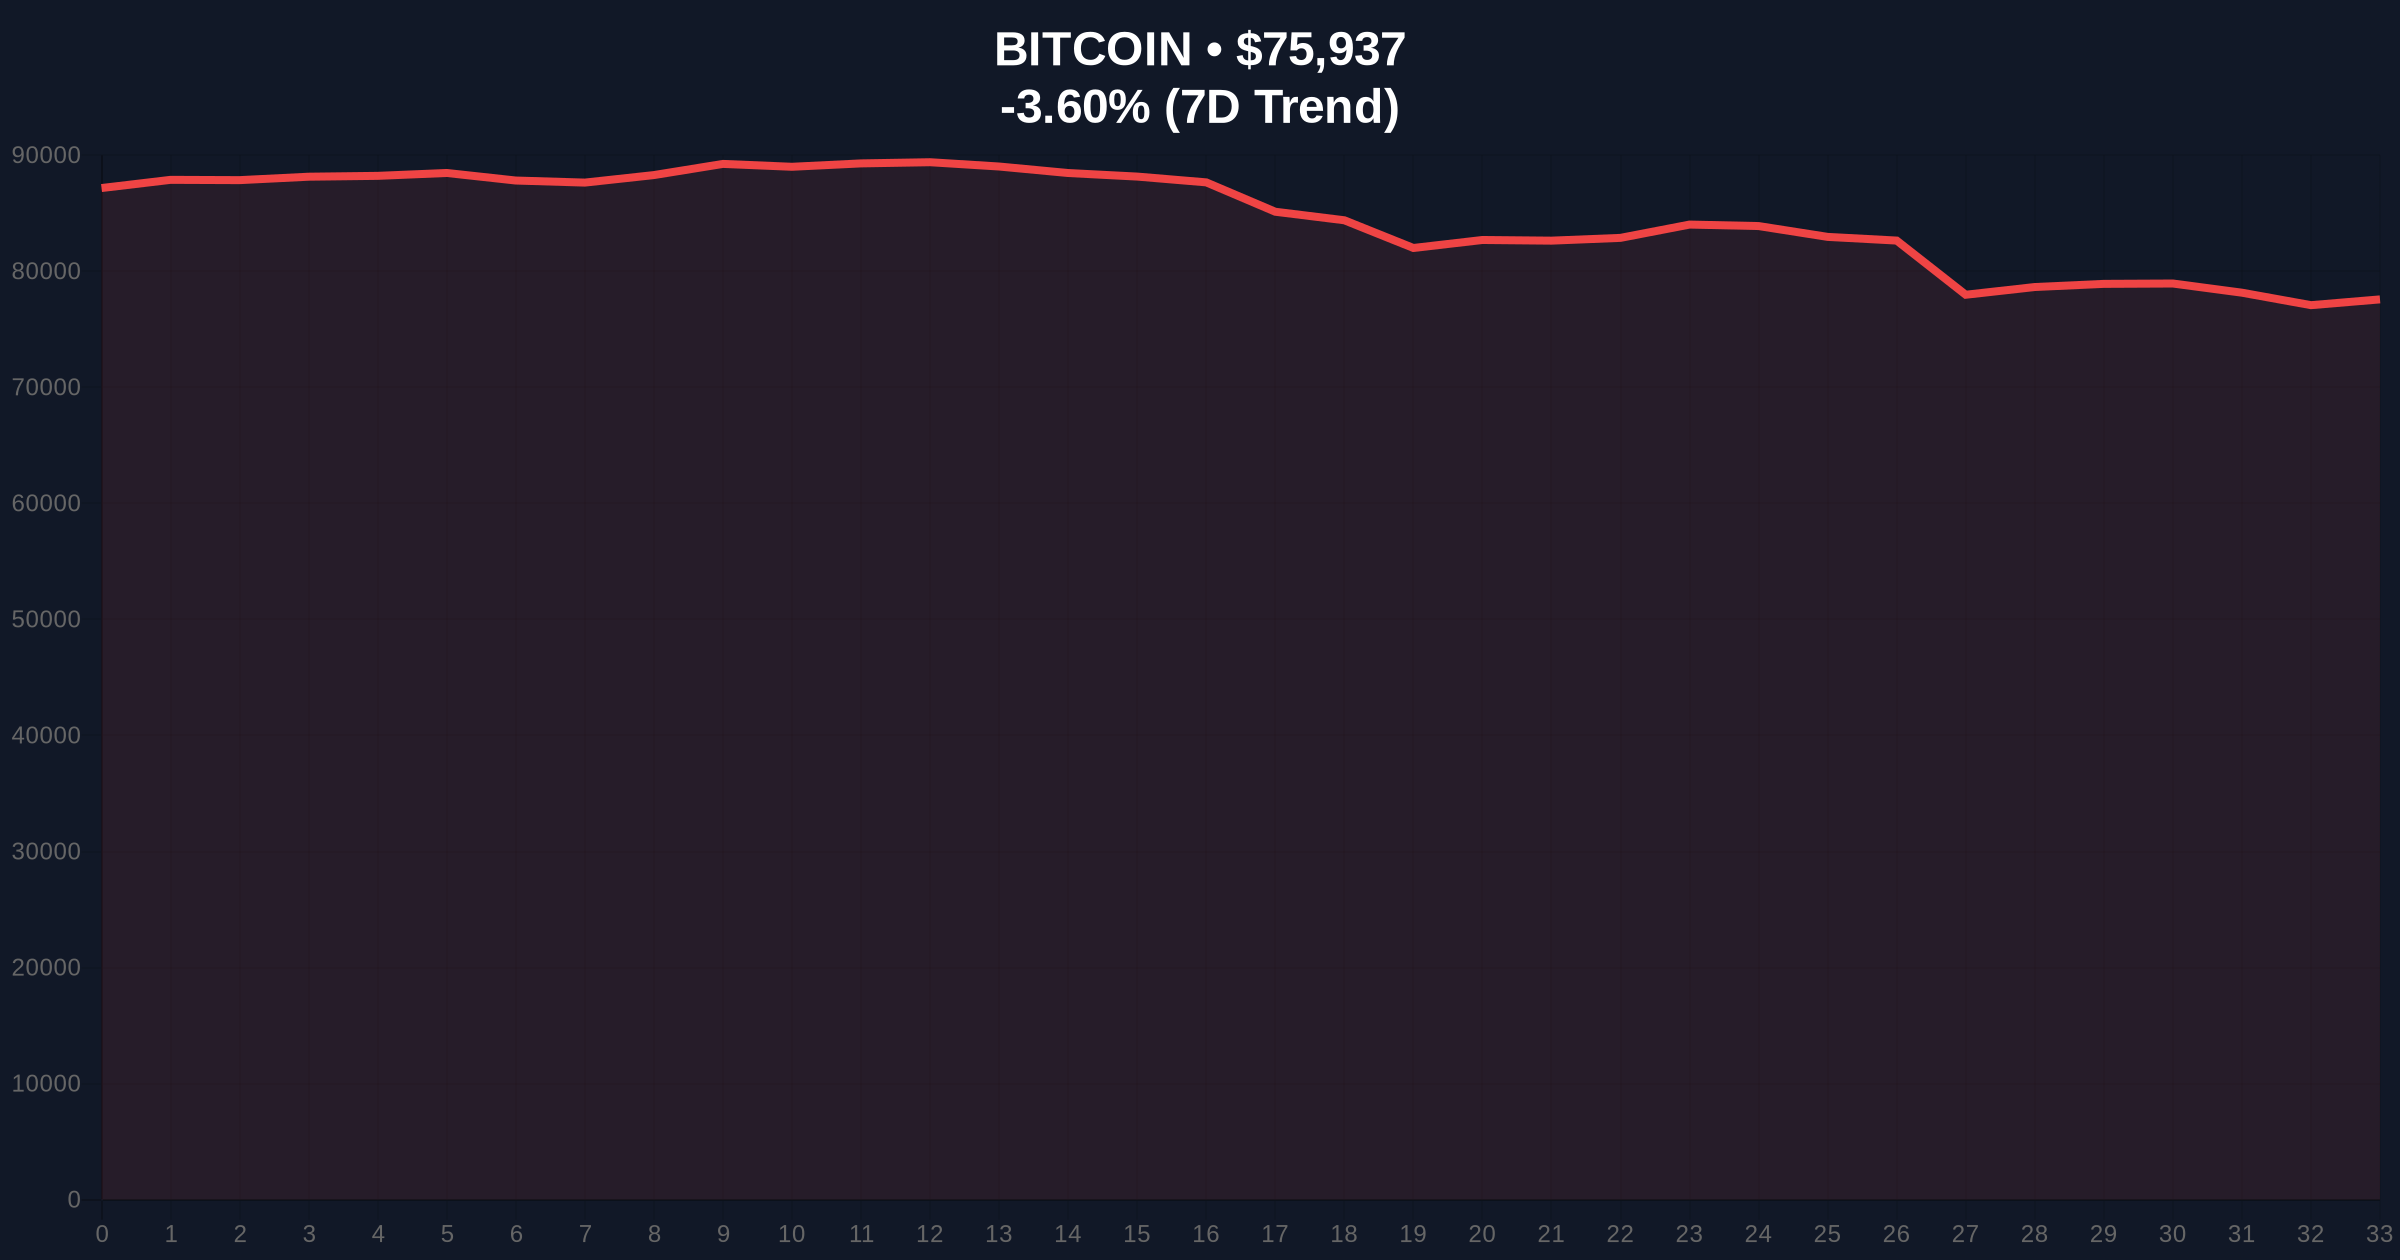
VADODARA, February 2, 2026 — Bitcoin price action shows a critical market structure contradiction as BTC reclaims the $76,000 psychological level while the Crypto Fear & Greed Index registers extreme fear at 14/100. According to CoinNess market monitoring data, BTC traded at $76,065.91 on the Binance USDT market, creating a technical divergence that demands institutional scrutiny.
Market structure suggests a deliberate liquidity grab occurred during Tuesday's trading session. According to CoinNess market monitoring, Bitcoin price action pushed through the $76,000 resistance level, establishing a temporary foothold above this psychological barrier. The Binance USDT market recorded the exact price at $76,065.91, creating what technical analysts would identify as a potential Fair Value Gap (FVG) between $75,500 and $76,200.
This price action contradicts the prevailing market sentiment. The Crypto Fear & Greed Index, a widely monitored sentiment indicator, registered extreme fear at 14/100 during the same period. Historical cycles suggest such divergences between price action and sentiment often precede significant market moves, either as false breakouts or genuine trend reversals.
Historically, Bitcoin price action during extreme fear periods has produced both capitulation bottoms and violent short squeezes. The current market structure mirrors patterns observed during the 2018 bear market bottom and the 2020 COVID crash recovery. In contrast to previous cycles, institutional participation through spot Bitcoin ETFs has altered traditional market dynamics.
Underlying this trend, recent market developments show increased volatility. For instance, BTC recently broke below the $74,508 support level, creating what technical analysts identify as a bearish order block. , crypto futures liquidations hit $144 million in one hour amid similar sentiment conditions, indicating leveraged positions remain vulnerable to sudden price movements.
Market structure suggests the current Bitcoin price action sits at a critical Fibonacci confluence zone. The 0.618 retracement level from the 2025 all-time high aligns with the $76,000 psychological resistance. On-chain data indicates significant UTXO accumulation between $74,000 and $76,000, creating what volume profile analysis identifies as a high-volume node.
Technical indicators show contradictory signals. The 50-day moving average sits at $78,200, creating overhead resistance, while the 200-day moving average provides support at $72,500. The Relative Strength Index (RSI) on daily timeframes shows neutral positioning at 48, neither overbought nor oversold. This technical ambiguity reinforces the market structure contradiction between price action and sentiment.
| Metric | Value | Significance |
|---|---|---|
| Crypto Fear & Greed Index | 14/100 (Extreme Fear) | Contrarian bullish signal historically |
| BTC Current Price | $75,878 | Below recent high of $76,065.91 |
| 24-Hour Trend | -3.67% | Indicates volatility and potential retest |
| Market Rank | #1 | Dominance remains intact |
| Critical Support Level | $74,508 | Previous 9-month low that must hold |
This Bitcoin price action matters because it tests institutional conviction during extreme fear conditions. Market structure suggests large players may be accumulating at these levels, using retail fear as cover. The Federal Reserve's monetary policy stance, as documented in their official monetary policy documentation, continues to influence macro liquidity conditions that affect crypto markets.
Real-world evidence shows institutional liquidity cycles typically precede major moves. The current market structure, with Bitcoin price action reclaiming $76,000 amid extreme fear, creates conditions ripe for either a gamma squeeze higher or a liquidity cascade lower. Retail market structure appears fragile, with recent liquidations hitting $369 million as longs dominated during similar sentiment extremes.
"Market structure suggests we're witnessing a classic sentiment-price divergence. The Bitcoin price action reclaiming $76,000 while the Fear & Greed Index shows extreme fear creates what quantitative models identify as a high-probability reversal signal. However, traders must watch order flow at the $74,508 level for confirmation." — CoinMarketBuzz Intelligence Desk
Market structure suggests two primary scenarios based on current Bitcoin price action and on-chain metrics.
The 12-month institutional outlook depends on whether this Bitcoin price action represents genuine accumulation or a bull trap. Historical cycles suggest extreme fear periods during uptrends often mark intermediate bottoms. The 5-year horizon remains constructive if Bitcoin maintains its store-of-value narrative amid evolving regulatory frameworks like South Korea's AI surveillance platform VISTA targeting market manipulation.

Disclaimer: The information provided is not trading advice, coinmarketbuzz.com holds no liability for any investments made based on the information provided on this page. We strongly recommend independent research and/or consultation with a qualified professional before making any investment decisions.
coinmarketbuzz.com leverages advanced AI technology to analyze market data. All content is fact-checked and reviewed by our editorial team to ensure accuracy and neutrality.


