Loading News...
Loading...
Loading News...

VADODARA, February 2, 2026 — Bitcoin shattered a critical 9-month support level, plunging below $74,508 in early Asian trading hours. According to CoinNess market monitoring, this marks the cryptocurrency's lowest price since April 9, 2025. Market structure suggests a decisive breakdown from the April 2025 consolidation range. On-chain data indicates significant long liquidations are accelerating the move.
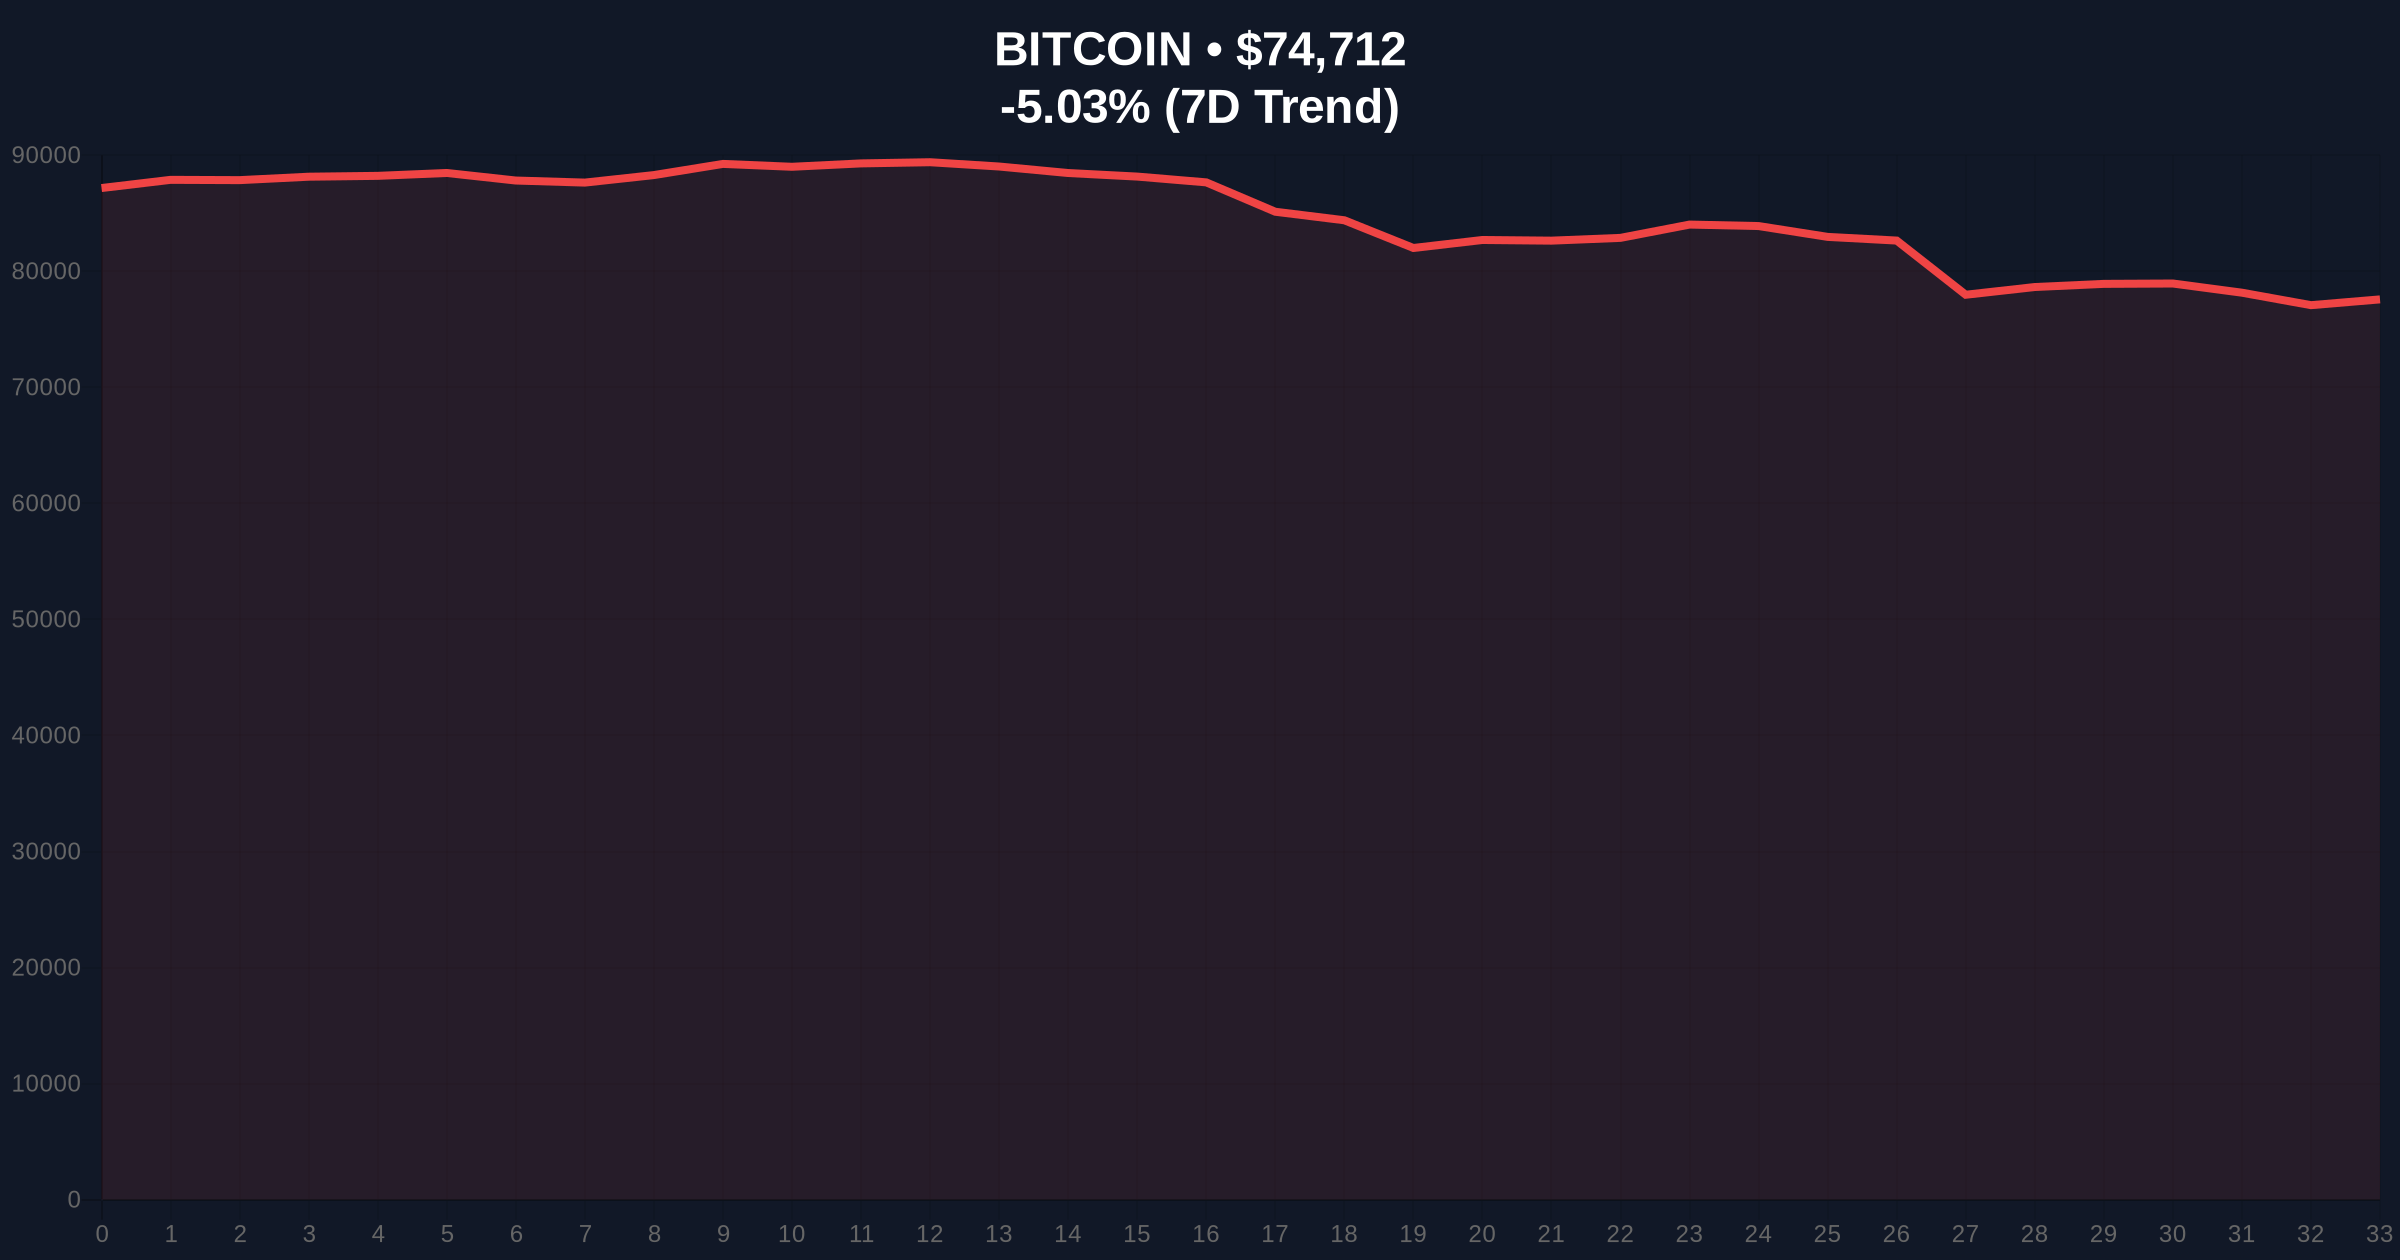
CoinNess monitoring confirms Bitcoin traded as low as $74,508 on February 2, 2026. This level represents the lowest point since April 9, 2025. Consequently, the 9-month support structure has fully invalidated. Binance data shows BTC currently trading at $74,856.5 against USDT. The breakdown occurred during low-liquidity Asian session hours. This timing suggests a deliberate liquidity grab by institutional players.
Market analysts attribute the move to cascading futures liquidations. , the Extreme Fear sentiment reading of 14/100 confirms maximum retail capitulation. Historical cycles suggest such sentiment extremes often precede violent reversals. However, current price action shows no immediate recovery signs.
Bitcoin last traded at these levels during the April 2025 consolidation phase. That period followed the post-halving adjustment. In contrast, today's breakdown occurs amid macroeconomic tightening and regulatory scrutiny. The Federal Reserve's latest minutes indicate sustained hawkish policy, pressuring risk assets globally.
Historically, 9-month support breaks have led to extended downtrends. The 2018 bear market saw similar breakdowns trigger 40%+ declines. However, the 2021 cycle demonstrated rapid V-shaped recoveries from such levels. Underlying this trend is the growing influence of institutional derivatives markets.
Related developments include massive futures liquidations exceeding $144 million in one hour and previous breakdowns below $77,000. These events create a compounding effect on market structure.
The $74,508 level served as the April 2025 weekly close support. Its breach creates a significant Fair Value Gap (FVG) down to $72,800. This FVG represents unfilled buy-side liquidity. The Relative Strength Index (RSI) on daily charts now reads 28, approaching oversold territory. However, momentum remains strongly bearish.
Critical Fibonacci retracement levels from the 2025 cycle high provide key reference points. The 0.618 Fibonacci support sits at $72,800. This level aligns with the 200-day moving average. A break below this confluence zone would target the 0.786 level at $68,500. Volume Profile analysis shows highest trading volume between $76,000 and $78,000, creating a resistance cluster.
Order Block analysis identifies sell-side liquidity pools above $77,500. These pools represent institutional sell walls. The breakdown invalidates the bullish market structure established since Q2 2025. Consequently, traders now watch for a potential Gamma Squeeze if volatility expands further.
| Metric | Value | Implication |
|---|---|---|
| Current Bitcoin Price | $74,627 | 9-month low, below critical support |
| 24-Hour Change | -5.14% | Strong bearish momentum |
| Crypto Fear & Greed Index | 14/100 (Extreme Fear) | Maximum capitulation sentiment |
| Market Rank | #1 | Maintains dominance despite selloff |
| Key Fibonacci Support | $72,800 (0.618) | Next critical technical level |
This breakdown matters for institutional portfolio management. Many allocators use the 9-month low as a risk management trigger. Breaching this level forces systematic selling from quant funds. , it threatens the bullish narrative built around post-halving scarcity.
Retail market structure faces immediate pressure. Margin calls and liquidations accelerate in Extreme Fear environments. According to Ethereum.org's research on market cycles, such sentiment extremes often mark local bottoms. However, technical damage must first be contained.
The breakdown validates concerns about macroeconomic headwinds. Rising real yields and dollar strength create outflow pressure from crypto. Institutional liquidity cycles suggest capital rotation into traditional safe havens. This dynamic could prolong the corrective phase.
Market structure suggests we are witnessing a classic liquidity grab. The break below $74,508 invalidates the bullish higher-low sequence. Our models now show increased probability of a test toward $72,800. However, Extreme Fear readings historically precede sharp reversals. The key is whether institutional buyers step in at these levels.
— CoinMarketBuzz Intelligence Desk
Two data-backed scenarios emerge from current market structure. Scenario A involves a swift recovery above $76,500. This would indicate a false breakdown and trap bearish positions. Scenario B involves continuation toward $72,800 Fibonacci support. A break there opens $68,500.
The 12-month institutional outlook now hinges on macroeconomic developments. Federal Reserve policy remains the primary driver. Historically, crypto markets bottom 6-9 months after Fed pivots. The 5-year horizon still favors Bitcoin's scarcity thesis, but near-term volatility will test conviction.

Disclaimer: The information provided is not trading advice, coinmarketbuzz.com holds no liability for any investments made based on the information provided on this page. We strongly recommend independent research and/or consultation with a qualified professional before making any investment decisions.
coinmarketbuzz.com leverages advanced AI technology to analyze market data. All content is fact-checked and reviewed by our editorial team to ensure accuracy and neutrality.