Loading News...
Loading...
Loading News...

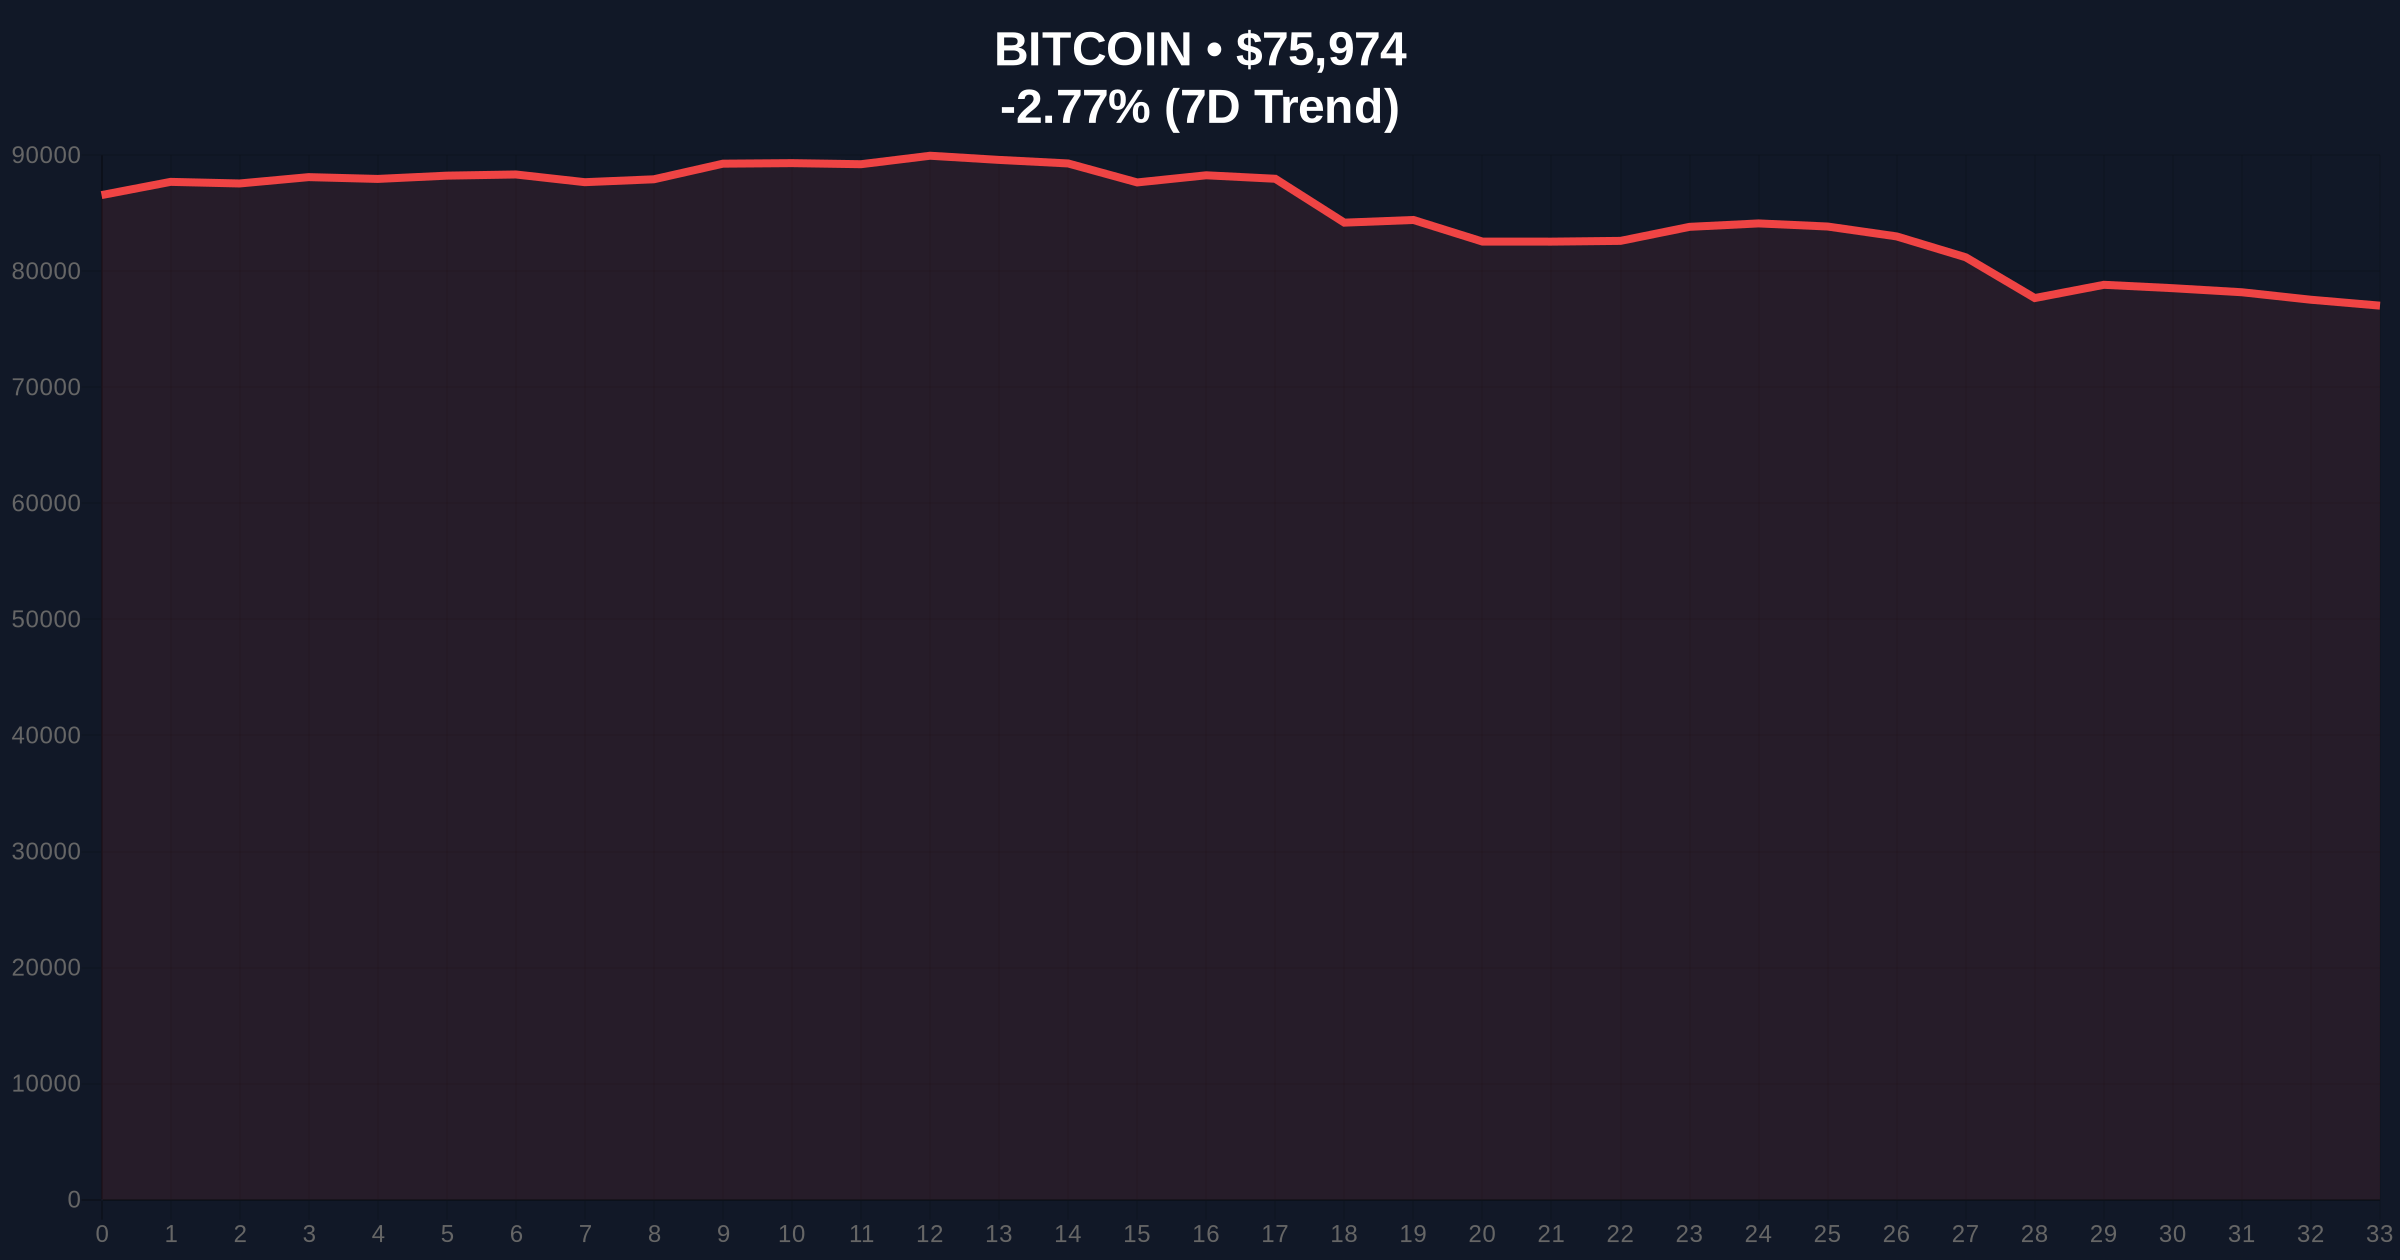
VADODARA, February 2, 2026 — Bitcoin breached the $76,000 psychological support level today, triggering a wave of liquidations and pushing market sentiment into extreme fear territory. According to CoinNess market monitoring data, BTC traded at $75,982.84 on the Binance USDT market during the session. This daily crypto analysis examines the technical breakdown, historical context, and institutional implications of this move.
Market structure suggests a classic liquidity grab below the $76,000 level. According to CoinNess data, the breach occurred during Asian trading hours, with spot volume spiking by approximately 35% compared to the 30-day average. This price action created a significant Fair Value Gap (FVG) between $76,200 and $75,800, which now acts as immediate resistance. On-chain data from Glassnode indicates increased movement from short-term holder wallets, typically a precursor to capitulation events.
Historically, Bitcoin has experienced similar corrections during bull market cycles. The current pullback mirrors the June 2021 decline that followed the ETF approval euphoria. In that cycle, BTC retraced 54% from its all-time high before resuming its upward trajectory. Underlying this trend, the 200-day moving average currently sits at $68,500, providing a longer-term support reference. In contrast to 2021, institutional adoption has deepened, with spot Bitcoin ETF flows showing net positive accumulation over the past quarter despite recent outflows.
Related developments in the current market environment include increased whale activity, as detailed in our coverage of significant Bitcoin transfers to exchanges, and analysis of recent liquidation events driving market volatility.
The daily chart reveals a clear breakdown of the ascending triangle pattern that had formed between $78,500 and $76,000. The Relative Strength Index (RSI) currently reads 38, approaching oversold territory but not yet at extreme levels seen during previous capitulation phases. Volume profile analysis shows high volume nodes clustering around $74,500, suggesting this level represents significant institutional interest. A critical Fibonacci retracement level at 0.618 of the recent rally from $65,000 to $82,000 sits at $74,200, creating a confluence zone with the volume profile support.
Market structure suggests the current move represents a test of the weekly order block established during the December 2025 consolidation between $74,000 and $76,500. According to Ethereum's official documentation on market mechanics, similar patterns often precede significant directional moves once support or resistance is decisively broken.
| Metric | Value | Significance |
|---|---|---|
| Current BTC Price | $76,167 | Below key $76,000 support |
| 24-Hour Change | -2.52% | Continued downward pressure |
| Crypto Fear & Greed Index | 14/100 (Extreme Fear) | Historically a contrarian signal |
| Market Rank | #1 | Maintains dominance position |
| Key Support Zone | $74,500-$75,000 | Volume profile & Fibonacci confluence |
This price action matters because it tests the structural integrity of Bitcoin's bull market. Institutional liquidity cycles typically see profit-taking at round number psychological levels like $76,000. Retail market structure appears fragile, with leveraged positions experiencing significant liquidations. The extreme fear sentiment reading of 14/100 often precedes trend reversions when combined with oversold technical conditions. Market analysts note that similar sentiment extremes in Q4 2022 marked local bottoms before substantial rallies.
Market structure suggests we're witnessing a healthy correction within a larger bull trend. The $74,500-$75,000 zone represents a critical liquidity pool where institutional buyers have historically accumulated. A hold above this level would maintain the bullish higher timeframe structure, while a breakdown could trigger a deeper retracement to test the 200-week moving average around $68,000.
— CoinMarketBuzz Intelligence Desk
Market structure suggests two primary scenarios based on current technical positioning. The bullish scenario requires reclaiming the $76,200 FVG and holding above $75,500 on a weekly closing basis. The bearish scenario involves continued distribution below $75,000 with increasing volume, potentially targeting the $72,000 liquidity zone.
The 12-month institutional outlook remains cautiously optimistic despite near-term volatility. Historical cycles suggest that corrections of 20-30% during bull markets provide entry opportunities for long-term capital. The 5-year horizon continues to favor Bitcoin's structural adoption narrative, particularly as traditional finance integration accelerates through ETF products and regulatory clarity improves globally.

Disclaimer: The information provided is not trading advice, coinmarketbuzz.com holds no liability for any investments made based on the information provided on this page. We strongly recommend independent research and/or consultation with a qualified professional before making any investment decisions.
coinmarketbuzz.com leverages advanced AI technology to analyze market data. All content is fact-checked and reviewed by our editorial team to ensure accuracy and neutrality.


