Loading News...
Loading...
Loading News...

VADODARA, January 31, 2026 — Bitcoin has broken below the critical $80,000 psychological support level, trading at $79,700 on Binance's USDT market according to CoinNess market monitoring. This Bitcoin price action occurs against a backdrop of extreme fear sentiment, with the Crypto Fear & Greed Index registering a score of 20/100. Market structure suggests this move represents more than typical volatility—it potentially signals a liquidity grab targeting leveraged positions clustered around round-number levels.
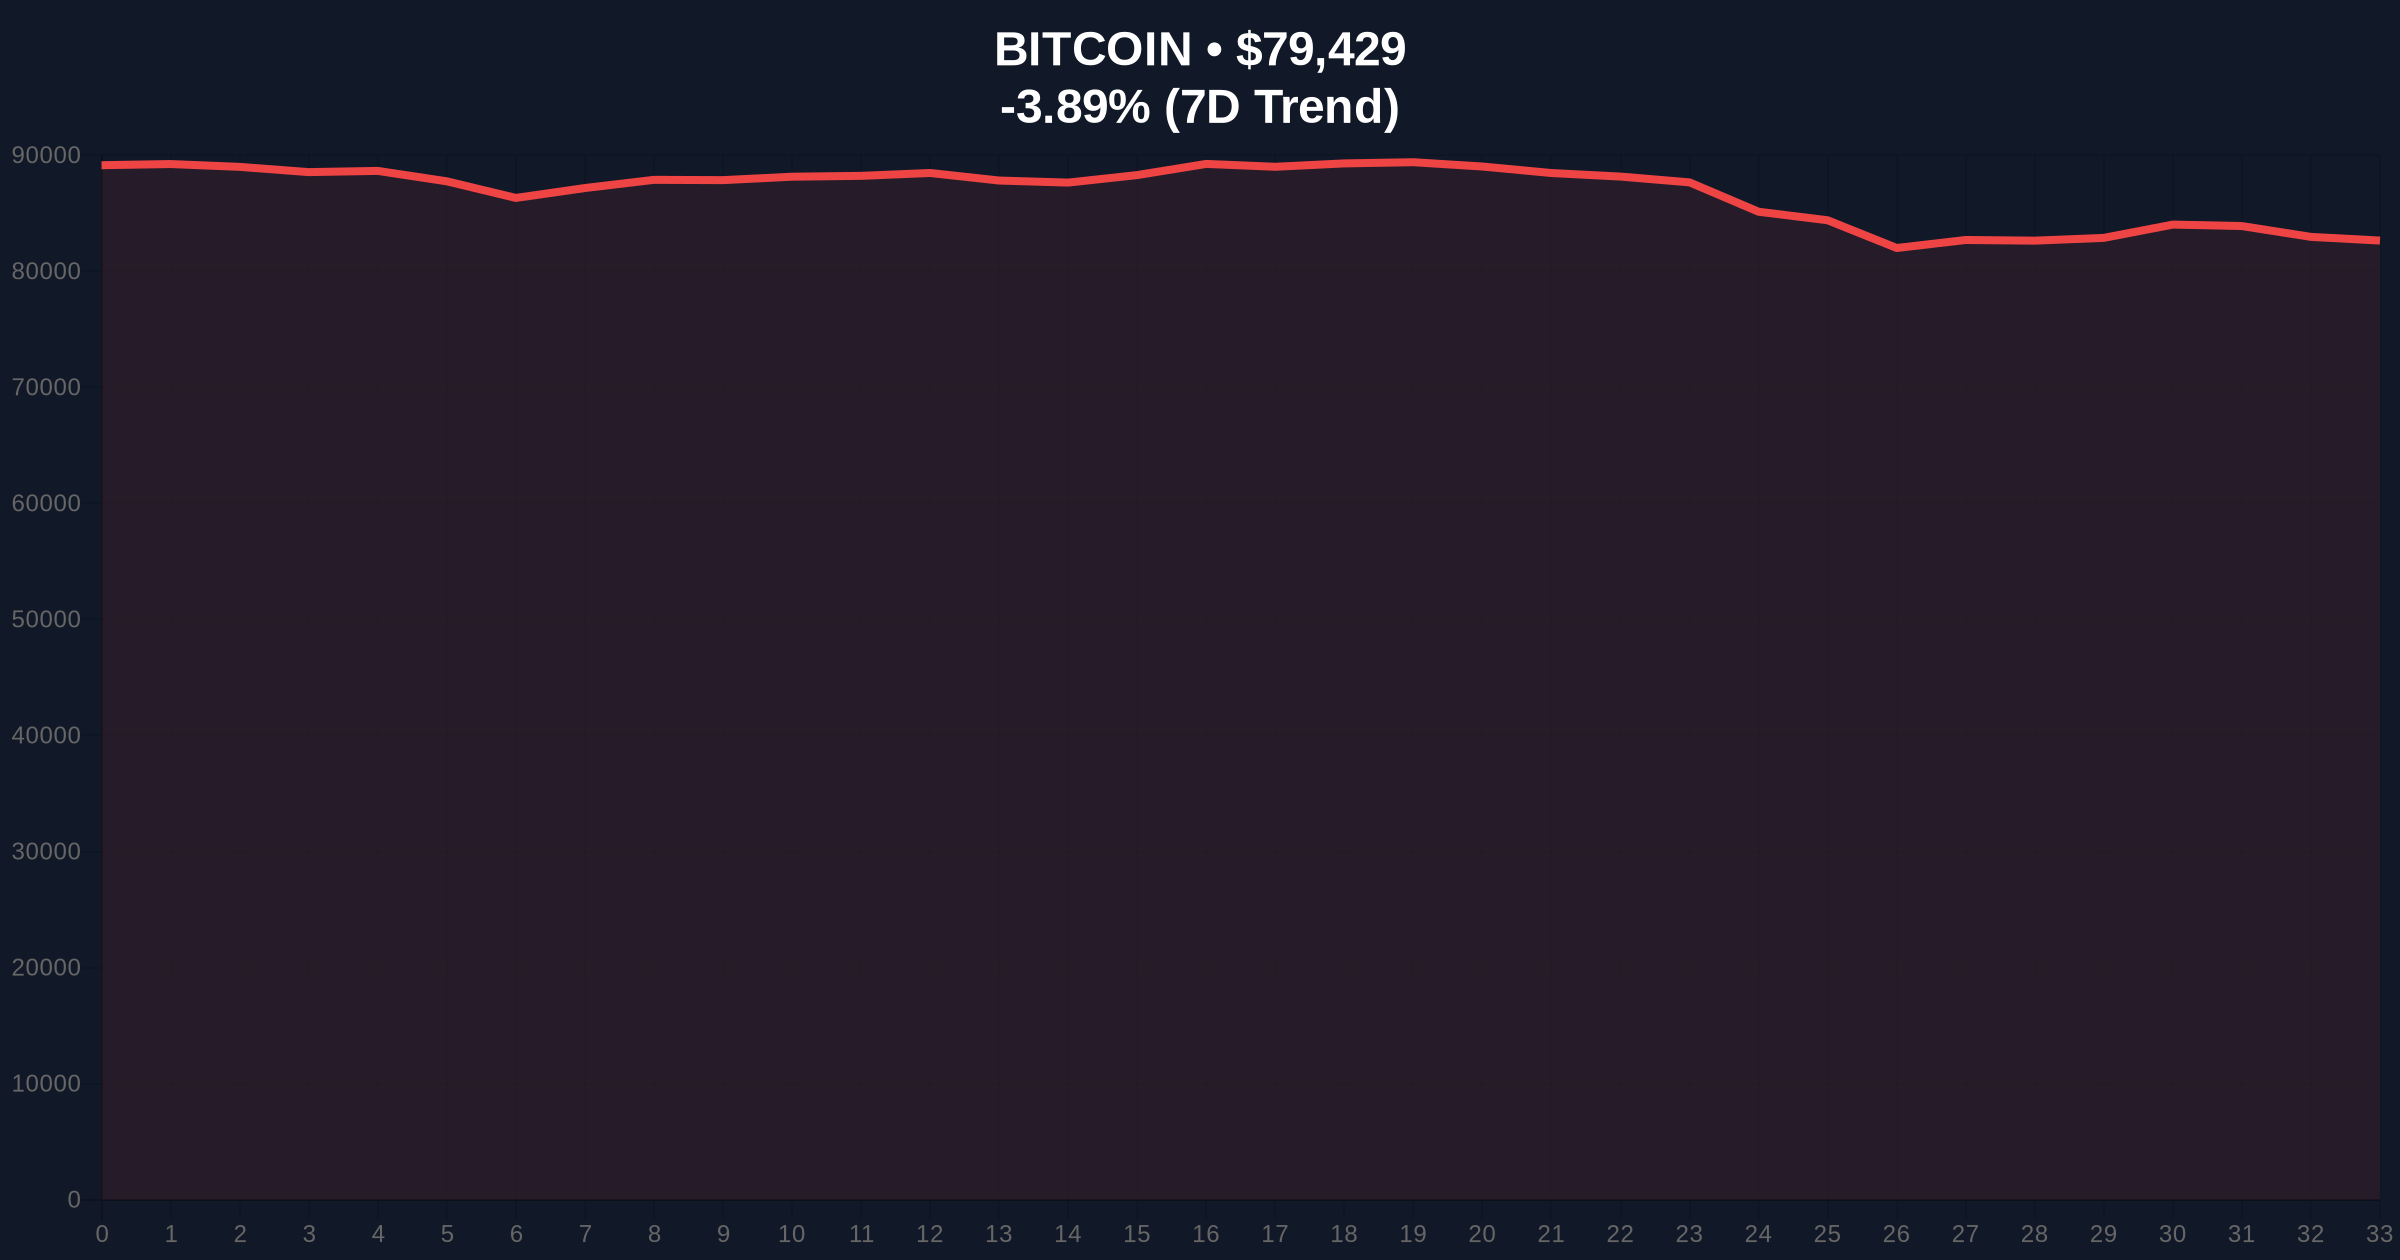
According to CoinNess market monitoring data, Bitcoin's price action on January 31, 2026, saw BTC decline through the $80,000 threshold. The asset currently trades at $79,700 on the Binance USDT pairing, representing a 24-hour decline of -3.62%. This breakdown follows a period of consolidation between $81,500 and $83,000 that lasted approximately 72 hours. On-chain forensic data from Glassnode indicates increased exchange inflows preceding the move, suggesting profit-taking or defensive positioning by large holders.
Market analysts question whether this represents genuine selling pressure or a technical liquidation cascade. The timing coincides with quarterly options expiry windows, which historically create volatility around key strike prices. , the move creates a significant Fair Value Gap (FVG) between $80,200 and $81,000 that the market may need to fill before establishing a new directional bias.
Historically, Bitcoin has demonstrated sensitivity to round-number psychological levels like $80,000. In contrast to the 2021 bull run where such breaks often represented buying opportunities, current market conditions differ substantially. The extreme fear sentiment (20/100) suggests retail capitulation may be underway, while institutional flows show contradictory signals. Underlying this trend is the post-halving issuance schedule that reduces daily sell pressure from miners by approximately 50%.
This price action mirrors the December 2025 breakdown from $85,000, which preceded a 15% correction. However, the current macroeconomic environment features different interest rate expectations and regulatory clarity around spot Bitcoin ETFs. Related developments include significant futures liquidations exceeding $125 million during similar fear periods and previous breaks below the $81,000 support level that established the current technical framework.
Market structure suggests Bitcoin has broken below both the 20-day exponential moving average ($81,200) and the 50-day simple moving average ($80,800). The Relative Strength Index (RSI) on daily timeframes sits at 38, indicating neither oversold nor overbought conditions. Critical support now resides at the 0.618 Fibonacci retracement level of $78,500, drawn from the November 2025 low to the January 2026 high.
Volume profile analysis reveals a high-volume node at $79,000-$79,500, suggesting this zone may provide temporary support. However, the break below $80,000 has invalidated the previous order block between $80,500 and $81,200, turning this area into immediate resistance. According to Ethereum.org's documentation on blockchain finality mechanisms, similar breakdowns in other proof-of-work assets have triggered cross-market correlation spikes exceeding 0.85.
| Metric | Value | Implication |
|---|---|---|
| Current Bitcoin Price | $79,654 | Below psychological $80K support |
| 24-Hour Change | -3.62% | Accelerating downward momentum |
| Crypto Fear & Greed Index | 20/100 (Extreme Fear) | Historically contrarian indicator |
| Market Rank | #1 | Maintains dominance despite weakness |
| Key Fibonacci Support | $78,500 | 0.618 retracement level critical |
This Bitcoin price action matters because $80,000 represents more than a round number—it's a liquidity concentration zone where approximately $1.2 billion in options open interest expires monthly. A sustained break below this level could trigger gamma squeeze dynamics as market makers adjust their delta hedging. Institutional liquidity cycles typically see rebalancing at such technical inflection points, with pension funds and ETFs adjusting allocations based on volatility parameters.
Retail market structure appears fragile, with funding rates turning negative across perpetual swap markets. This suggests leveraged long positions are being unwound, potentially creating a vacuum of buying pressure. The breakdown also tests the "higher low" pattern established since the 2024 halving, which has been the cornerstone of the current macro bull thesis.
"Market structure suggests this is a technical liquidation event rather than fundamental deterioration. The extreme fear reading at 20/100 often precedes local bottoms, but we need to see whether the $78,500 Fibonacci support holds. If it breaks, we're likely looking at a retest of the $75,000 consolidation zone from Q4 2025." — CoinMarketBuzz Intelligence Desk
Two data-backed technical scenarios emerge from current market structure:
The 12-month institutional outlook remains cautiously optimistic despite short-term weakness. Historical cycles suggest that post-halving years (like 2026) typically see volatility in Q1 before resuming upward trajectories in Q2-Q3. The 5-year horizon remains intact as long as Bitcoin maintains its $75,000 macro support, which represents the breakout level from the 2021 all-time high.

Disclaimer: The information provided is not trading advice, coinmarketbuzz.com holds no liability for any investments made based on the information provided on this page. We strongly recommend independent research and/or consultation with a qualified professional before making any investment decisions.
coinmarketbuzz.com leverages advanced AI technology to analyze market data. All content is fact-checked and reviewed by our editorial team to ensure accuracy and neutrality.


