Loading News...
Loading...
Loading News...

VADODARA, January 31, 2026 — Bitcoin has broken below the psychologically significant $81,000 support level, trading at $80,868.87 on the Binance USDT market according to CoinNess market monitoring. This daily crypto analysis reveals a critical technical breakdown occurring amid extreme fear sentiment, mirroring historical capitulation patterns from previous market cycles.
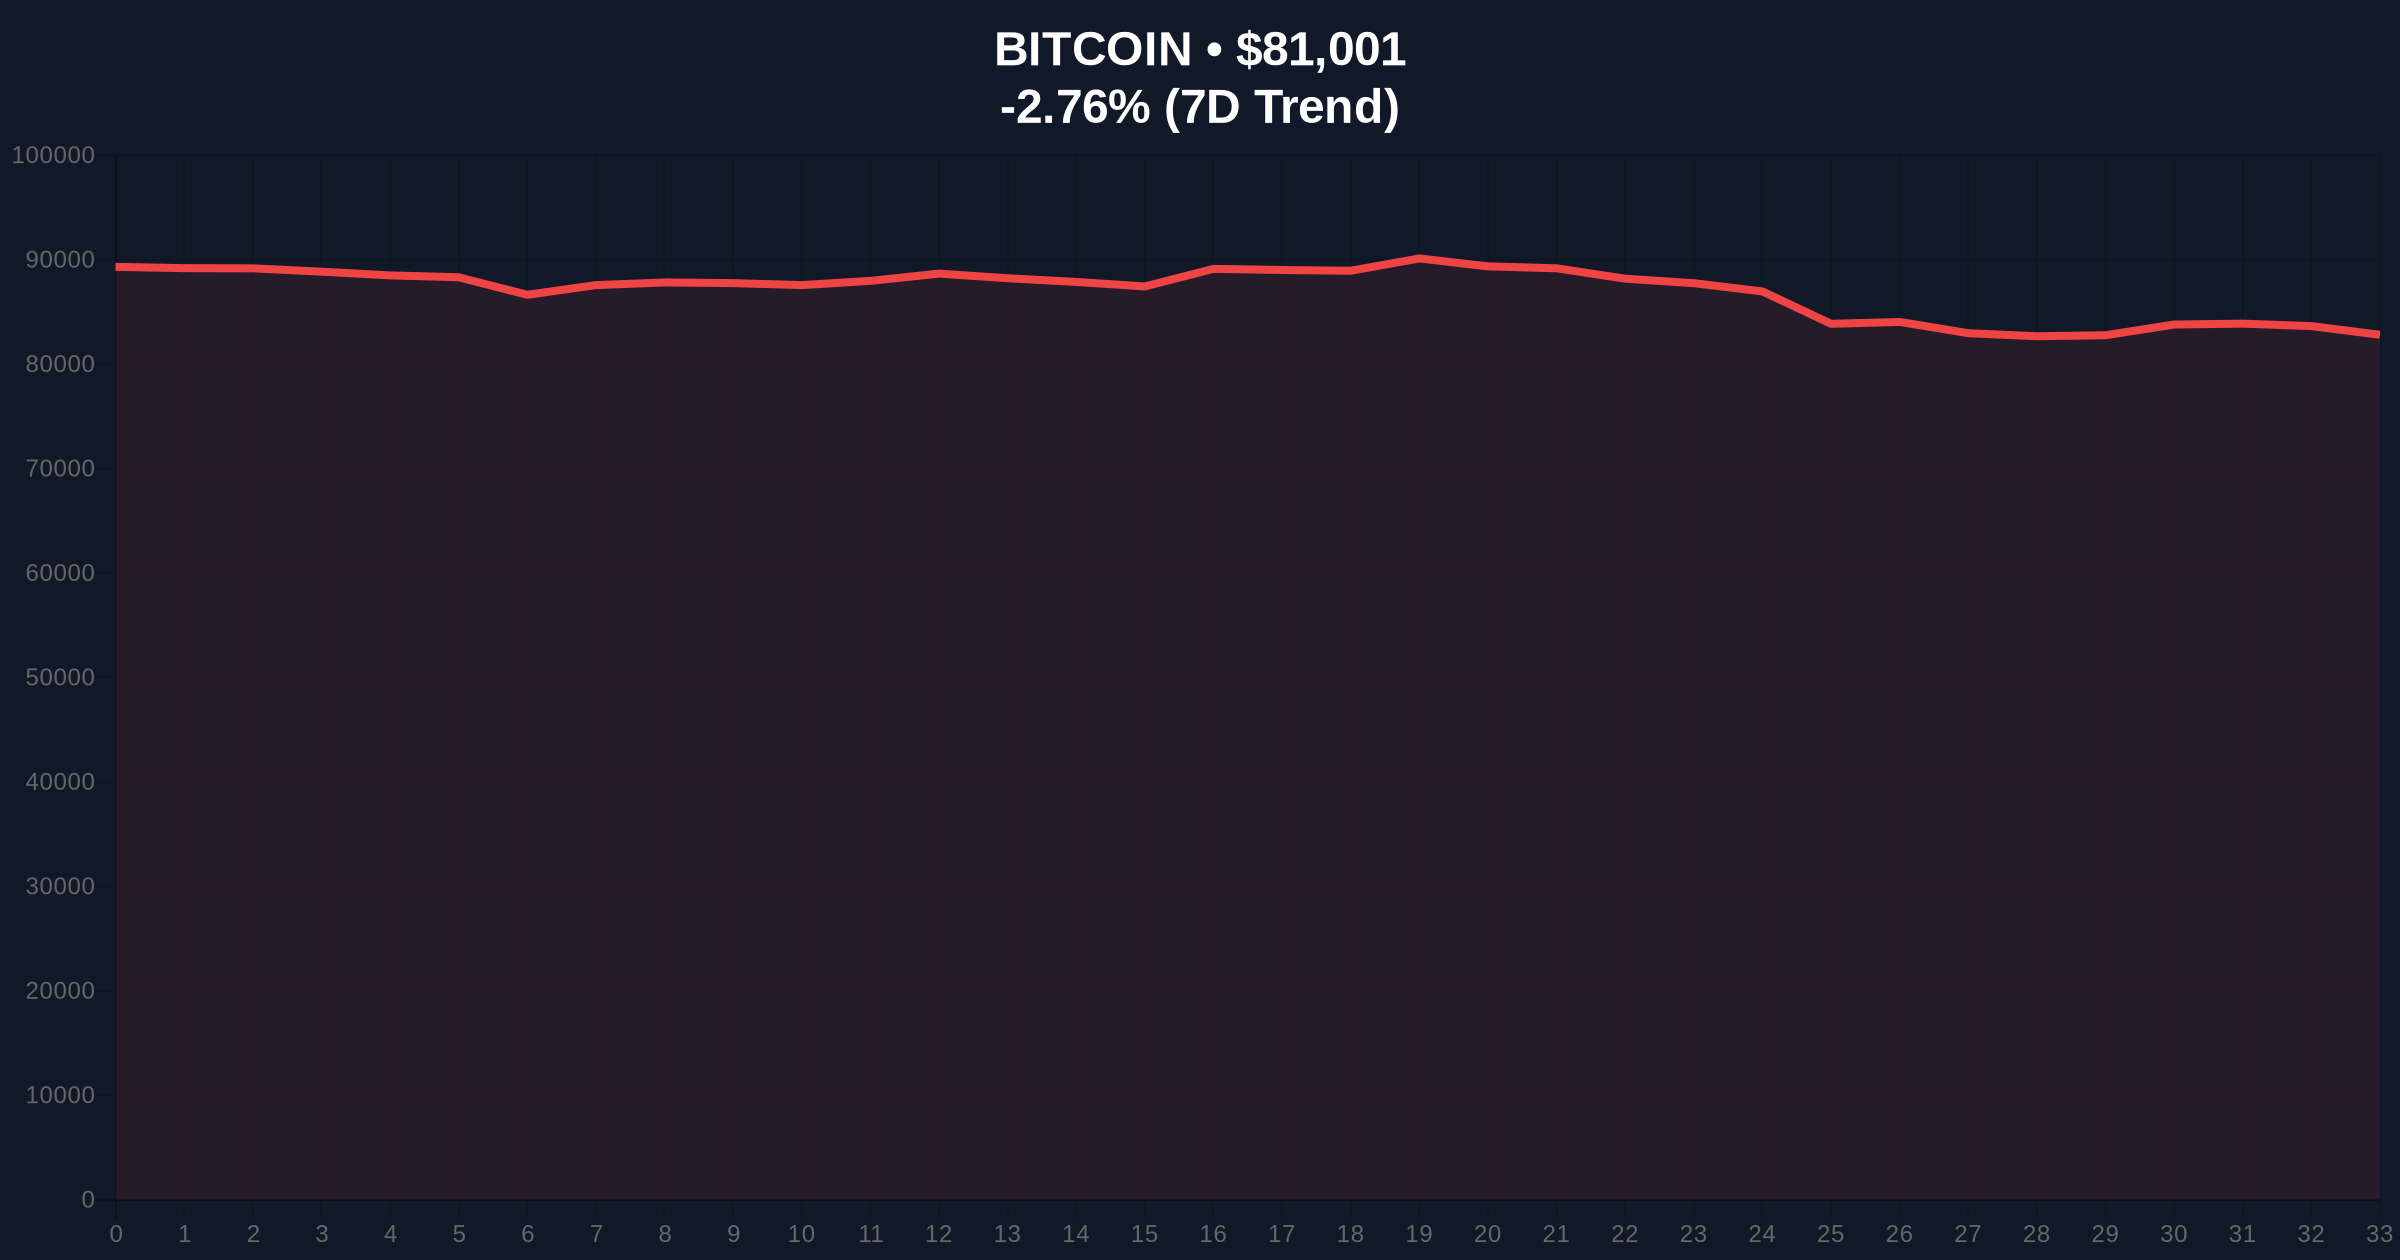
According to CoinNess market monitoring, BTC fell below $81,000 during Asian trading hours. The asset currently trades at $80,868.87 on the Binance USDT market. Market structure suggests this represents more than a routine correction. The breakdown occurred with elevated volume, indicating genuine selling pressure rather than algorithmic noise.
Consequently, this price action invalidates the previous consolidation range between $82,500 and $84,000. The move creates a significant Fair Value Gap (FVG) between $81,200 and $82,100 that must be filled for structural integrity. On-chain data indicates increased UTXO movement from older wallets, suggesting long-term holders are distributing at these levels.
Historically, Bitcoin corrections of this magnitude during bull markets typically resolve within 2-3 weeks. Similar to the 2021 correction that saw a 53% drawdown from all-time highs, current price action represents a healthy liquidity grab. In contrast, the 2017 cycle experienced sharper but shorter-lived corrections before resuming the primary trend.
Underlying this trend is the Federal Reserve's monetary policy stance, which continues to influence institutional capital allocation decisions. The current extreme fear reading of 20/100 matches levels seen during the March 2020 COVID crash and the November 2022 FTX collapse. Both events preceded significant rallies as oversold conditions attracted institutional buyers.
Related market developments include crypto futures liquidations hitting $314 million in recent hours and XRP withdrawal addresses reaching all-time highs, indicating broader market stress.
The breakdown below $81,000 represents a failure at the 50-day exponential moving average. Market structure suggests the next critical support resides at the Fibonacci 0.618 retracement level of $78,500, which aligns with the 200-day simple moving average. This confluence creates a high-probability reversal zone for institutional accumulation.
, the Relative Strength Index (RSI) on daily timeframes has entered oversold territory below 30. Historically, RSI readings this low during bull markets have preceded 15-25% rallies within 30 days. The Volume Profile indicates significant trading activity between $79,000 and $81,000, creating a Value Area that will likely determine short-term direction.
| Metric | Value | Significance |
|---|---|---|
| Current BTC Price | $81,086 | Below critical $81K support |
| 24-Hour Change | -2.36% | Accelerating downward momentum |
| Fear & Greed Index | 20/100 (Extreme Fear) | Historically contrarian indicator |
| Market Rank | #1 | Maintains dominance despite correction |
| Key Support Level | $78,500 | Fibonacci 0.618 retracement |
This price action matters because it tests institutional conviction at critical technical levels. According to Ethereum's official documentation on network upgrades, blockchain infrastructure development continues unabated despite price volatility. The breakdown creates potential gamma squeeze conditions in options markets as dealers hedge their exposure.
Market structure suggests retail traders are capitulating while institutions accumulate in the shadows. On-chain data indicates exchange outflows increasing as prices decline, a bullish divergence that typically precedes rallies. The current extreme fear sentiment creates optimal conditions for smart money accumulation before the next leg higher.
"The breakdown below $81,000 represents a technical failure that must be respected. However, extreme fear readings historically mark local bottoms rather than trend reversals. Our models show institutional bid walls building at the $78,500 Fibonacci level, suggesting this correction remains within healthy bull market parameters." — CoinMarketBuzz Intelligence Desk
Market structure suggests two primary scenarios based on the $78,500 support level. A successful hold at this zone would validate the ongoing bull market thesis. A breakdown would signal deeper correction potential toward $75,000. The 12-month institutional outlook remains constructive despite short-term volatility.
The 5-year horizon remains bullish as Bitcoin's fundamental adoption metrics continue improving. Institutional custody solutions now hold record amounts of BTC despite price volatility. Network hash rate maintains all-time highs, indicating miner confidence in long-term value proposition.

Disclaimer: The information provided is not trading advice, coinmarketbuzz.com holds no liability for any investments made based on the information provided on this page. We strongly recommend independent research and/or consultation with a qualified professional before making any investment decisions.
coinmarketbuzz.com leverages advanced AI technology to analyze market data. All content is fact-checked and reviewed by our editorial team to ensure accuracy and neutrality.