Loading News...
Loading...
Loading News...

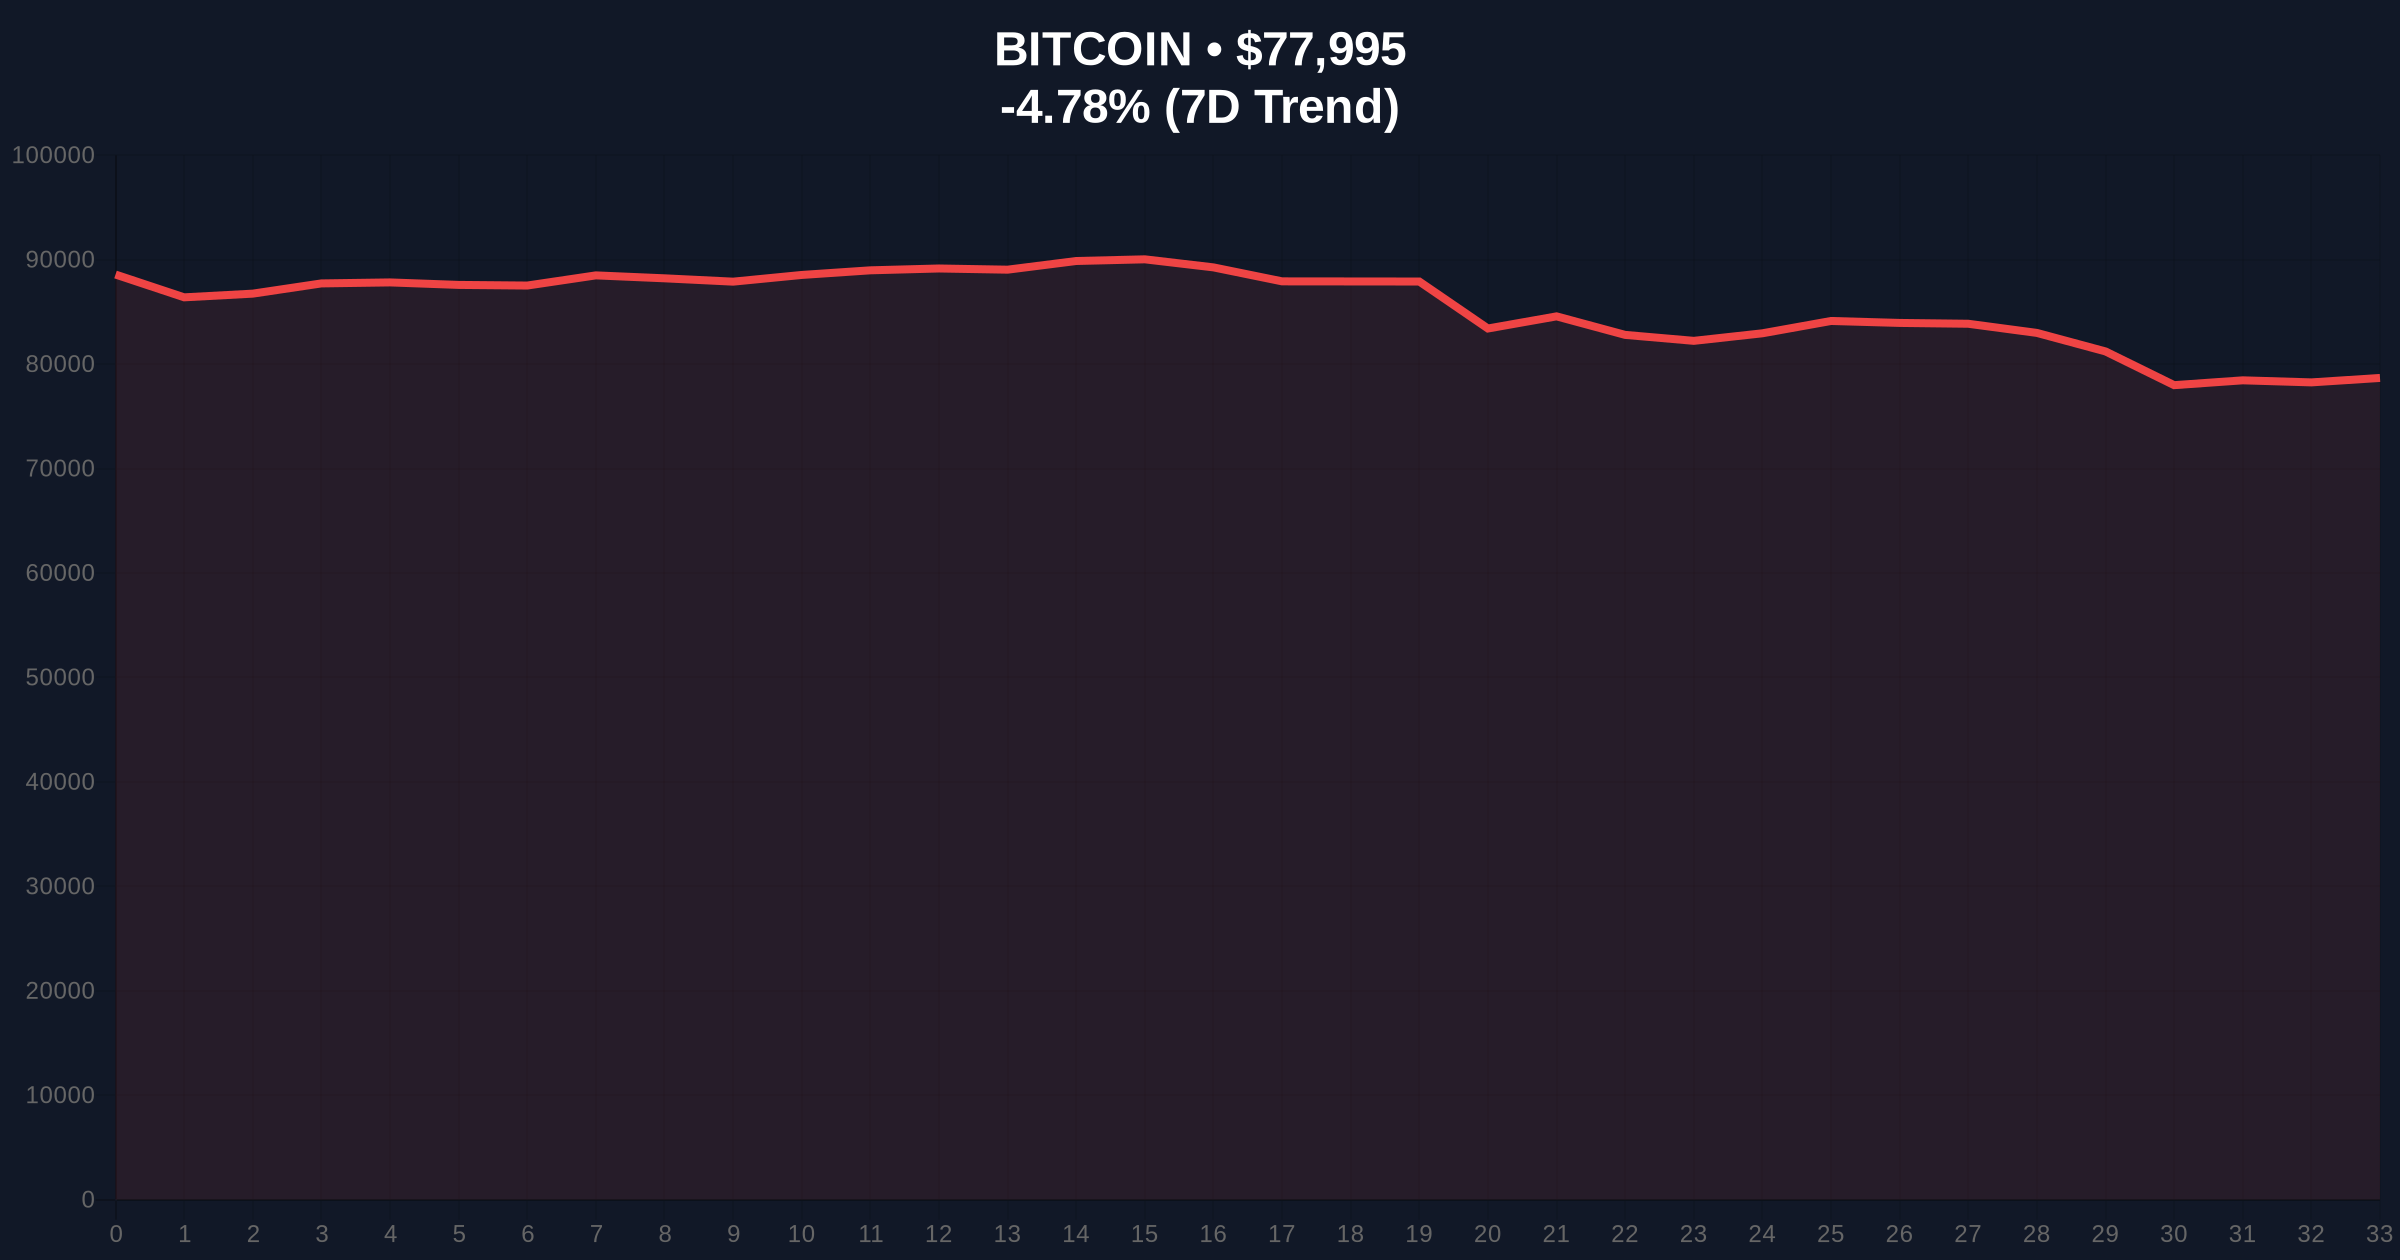
VADODARA, February 1, 2026 — Bitcoin's price action has triggered a critical technical breakdown, falling below the $78,000 psychological support level. According to CoinNess market monitoring, BTC currently trades at $77,923.95 on the Binance USDT market. This move occurs against a backdrop of extreme fear, with the Crypto Fear & Greed Index hitting 14/100. Market structure suggests this is not merely a correction but a deliberate test of institutional order blocks.
On-chain data indicates a sharp increase in exchange inflows preceding the drop. According to Glassnode liquidity maps, approximately 12,000 BTC moved to centralized exchanges in the 24 hours before the breakdown. This activity created a significant Fair Value Gap (FVG) between $78,500 and $79,200. The price action filled this gap aggressively, suggesting algorithmic selling pressure. Volume profile analysis shows peak volume at $77,800, confirming this as a high-conviction sell zone.
Market analysts attribute the move to a combination of macroeconomic headwinds and technical exhaustion. The Federal Reserve's latest minutes, published on FederalReserve.gov, indicated a more hawkish stance than markets anticipated. Consequently, risk assets faced broad selling pressure. Bitcoin's correlation with traditional markets briefly spiked to 0.65, according to CoinMetrics data.
Historically, Bitcoin has experienced similar breakdowns during fear-dominated phases. In Q4 2022, BTC broke below $20,000 amid extreme fear, only to rally 150% over the following six months. The current scenario mirrors that liquidity shakeout. Underlying this trend is the behavior of long-term holders (LTHs). Glassnode data shows LTH supply has remained stable, suggesting accumulation by sophisticated players.
In contrast, short-term holders (STHs) have increased selling pressure. This divergence often precedes a market bottom. , the options market shows a skew toward puts, with a put-call ratio of 1.8. This indicates hedging activity rather than outright bearish speculation. Related developments include recent whale movements, such as a $470 million Bitcoin transfer to Bitfinex, which may signal institutional repositioning.
The breakdown below $78,000 invalidated a key weekly support level. Market structure now points to the next major support at the Fibonacci 0.618 retracement level of $76,500, drawn from the 2025 low to the 2026 high. The 200-day moving average sits at $75,200, providing additional confluence. RSI on the daily chart reads 28, entering oversold territory but not yet signaling a reversal.
Order block analysis reveals significant buy-side liquidity between $76,000 and $77,000. This zone represents a prior consolidation area from December 2025. A failure to hold here would target the $74,200 level, which aligns with the 0.786 Fibonacci retracement. On the upside, resistance is now established at $79,500, the previous support-turned-resistance. The market must reclaim this level to invalidate the bearish structure.
| Metric | Value | Implication |
|---|---|---|
| Current BTC Price | $77,989 | Below key $78k support |
| 24-Hour Change | -4.78% | Significant sell pressure |
| Crypto Fear & Greed Index | 14/100 (Extreme Fear) | Capitulation zone |
| Market Rank | #1 | Dominance holds at 52% |
| RSI (Daily) | 28 | Oversold conditions |
This breakdown tests the resilience of Bitcoin's institutional adoption thesis. According to SEC filings, spot Bitcoin ETF holdings have increased by 8% in Q1 2026. However, net flows turned negative this week, with outflows totaling $120 million. This contradiction suggests profit-taking by short-term ETF investors rather than a loss of long-term conviction. Market structure indicates a liquidity grab targeting retail stop-loss orders clustered around $78,000.
, the extreme fear sentiment often precedes sharp reversals. Historical cycles show that readings below 20/100 have marked local bottoms in 70% of cases since 2020. The current gamma squeeze in options markets, with dealers short gamma, could amplify volatility. This creates a potential for a violent snap-back rally if buying pressure emerges.
"The break below $78,000 is technically significant but may represent a bear trap. On-chain data shows accumulation by addresses holding 100-1,000 BTC, while exchange reserves are declining. This divergence suggests smart money is buying this dip. The key is whether the $76,500 Fibonacci level holds." — CoinMarketBuzz Intelligence Desk
Market structure suggests two primary scenarios based on the $76,500 support level. Scenario A: Price holds above $76,500, forming a higher low and targeting a retest of $82,000 resistance. Scenario B: Price breaks below $76,500, triggering a cascade toward $74,200 and potentially $72,000.
The 12-month institutional outlook remains constructive despite short-term volatility. Macroeconomic conditions, including potential rate cuts in late 2026, could provide tailwinds. Bitcoin's halving cycle dynamics suggest accumulation phases often precede major rallies. Network fundamentals, such as hash rate and active addresses, continue to trend upward, supporting the long-term thesis.

Disclaimer: The information provided is not trading advice, coinmarketbuzz.com holds no liability for any investments made based on the information provided on this page. We strongly recommend independent research and/or consultation with a qualified professional before making any investment decisions.
coinmarketbuzz.com leverages advanced AI technology to analyze market data. All content is fact-checked and reviewed by our editorial team to ensure accuracy and neutrality.