Loading News...
Loading...
Loading News...

VADODARA, February 5, 2026 — Bitcoin price action turned decisively bearish today. According to CoinNess market monitoring, BTC broke below the critical $68,000 support level. The asset traded at $67,901.01 on the Binance USDT market. This move triggered a cascade of liquidations. Market sentiment plunged into Extreme Fear territory.
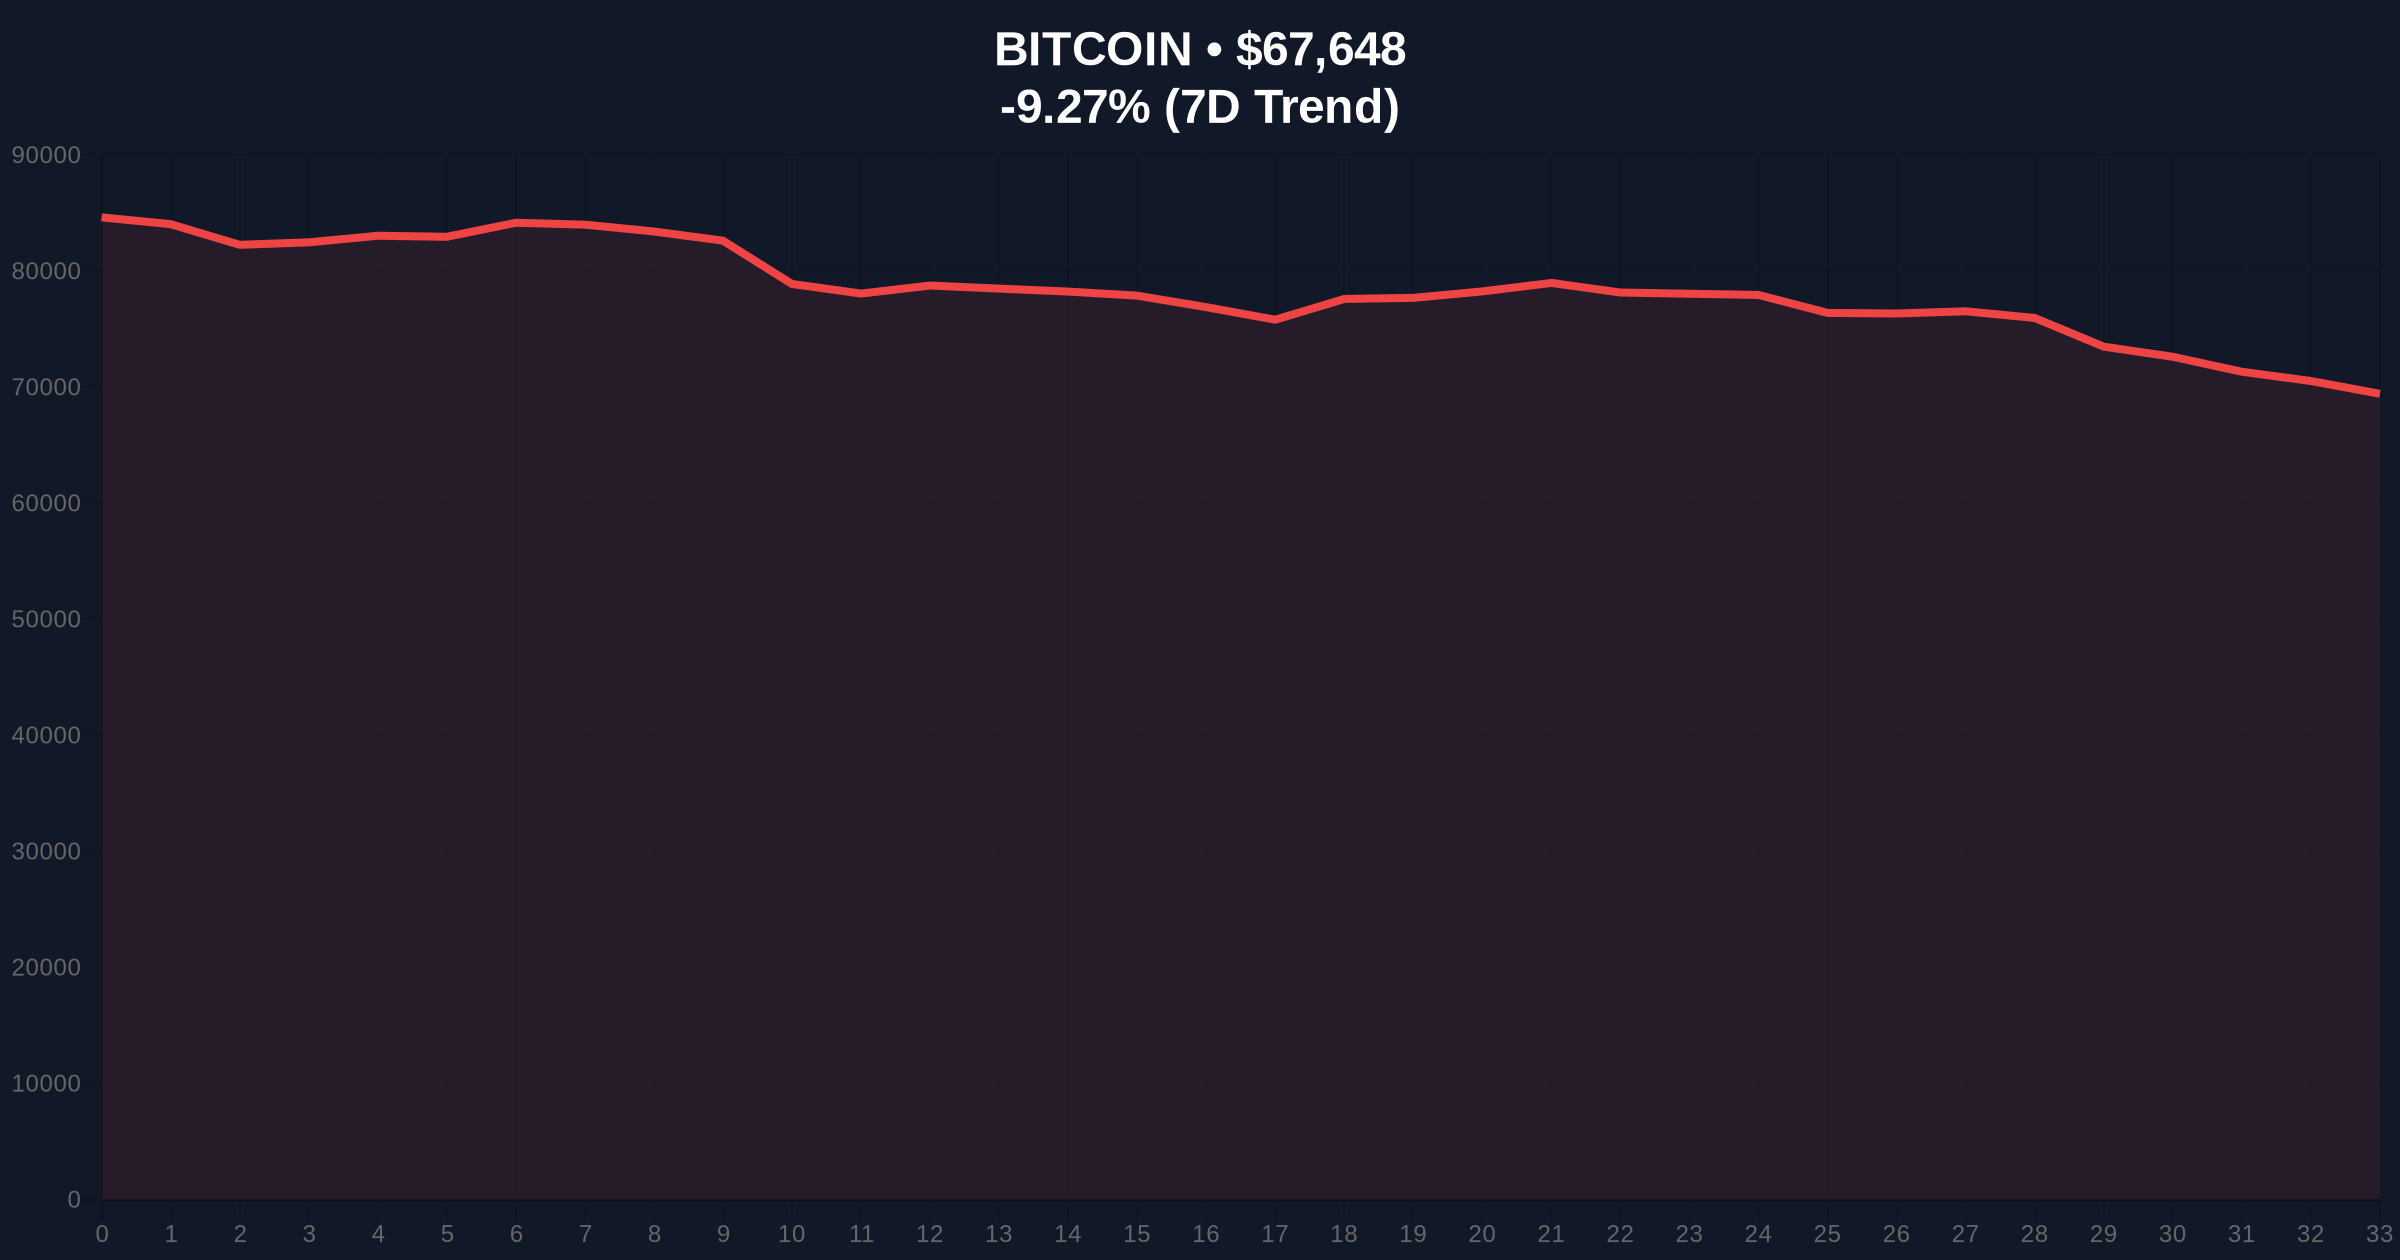
CoinNess data confirms the breakdown occurred during Asian trading hours. The $68,000 level had acted as a multi-week support zone. Its failure created a significant Fair Value Gap (FVG) on lower timeframes. This FVG now presents a potential retest target near $68,500. The 24-hour trend shows a sharp -8.61% decline. This price action suggests a classic liquidity grab. Bears are targeting stop-loss orders clustered just below the round-number support.
Market structure indicates a shift in order flow. The break below $68,000 invalidated a bullish order block established in late January. Consequently, the immediate technical outlook turned negative. On-chain data from Glassnode would likely show an increase in short-term holder supply moving to exchanges. This is typical capitulation behavior.
Historically, breaks below key psychological levels like $68,000 precede accelerated sell-offs. The 2021 cycle saw similar breaks at $50,000 and $40,000. Each led to a 15-20% correction before stabilization. In contrast, the 2023-2024 bull run was characterized by shallower, faster corrections. The current move tests that resilience.
Underlying this trend is a macro liquidity shift. The Federal Reserve's latest policy statements, available on FederalReserve.gov, suggest a tightening bias. This pressures risk assets globally. Bitcoin's correlation with traditional markets has increased. , institutional products are evolving to manage yield in volatile conditions, as seen in the recent launch of custom yield strategies by Kraken and Bitwise.
Related Developments:
The breakdown targets the next major Fibonacci support at $65,000. This is the 0.618 retracement level from the 2025 low to the recent high. The 200-day moving average converges near $64,200, adding confluence. The Relative Strength Index (RSI) on daily charts is approaching oversold territory. However, it has not yet reached extreme levels seen at past cycle bottoms.
Volume Profile analysis shows high-volume nodes between $66,000 and $68,000. A reclaim of this zone is critical for bulls. The current price action below it suggests distribution. The UTXO (Unspent Transaction Output) age bands will be to watch. An increase in young UTXOs (1d-1w) moving would confirm panic selling. The EIP-4844 upgrade on Ethereum's roadmap, detailed on Ethereum.org, is a key technical divergence but does not offset Bitcoin's immediate macro pressure.
| Metric | Value |
|---|---|
| Crypto Fear & Greed Index | Extreme Fear (12/100) |
| Bitcoin Current Price | $68,139 |
| 24-Hour Price Change | -8.61% |
| Key Support Break | $68,000 |
| Market Rank | #1 |
This break matters for portfolio risk management. The $68,000 level was a liquidity pool for institutional orders. Its failure triggers algorithmic selling and margin calls. Retail market structure is now vulnerable. Historical cycles suggest such moves wash out weak hands. They create opportunity for strategic accumulation at lower levels.
Institutional liquidity cycles are entering a risk-off phase. The Extreme Fear reading at 12/100 often precedes a sentiment reversal. However, it requires a price catalyst. The current move tests the durability of the post-2024 bull market structure. A hold above $65,000 would suggest strong underlying demand. A break below could trigger a gamma squeeze in options markets, accelerating the decline.
Market structure suggests this is a controlled demolition of overleveraged long positions. The Fair Value Gap up to $68,500 is the immediate magnet. Our models indicate the $65,000 Fibonacci zone is the next major battleground. A weekly close below that would target $62,000. This is a liquidity event, not a fundamental breakdown.
— CoinMarketBuzz Intelligence Desk
Two data-backed scenarios emerge from current market structure.
The 12-month institutional outlook remains cautiously optimistic. This correction aligns with mid-cycle pullbacks observed in prior Bitcoin epochs. The 5-year horizon is shaped by adoption curves, not daily volatility. However, a failure to hold $65,000 could extend the consolidation phase into Q2 2026.

Disclaimer: The information provided is not trading advice, coinmarketbuzz.com holds no liability for any investments made based on the information provided on this page. We strongly recommend independent research and/or consultation with a qualified professional before making any investment decisions.
coinmarketbuzz.com leverages advanced AI technology to analyze market data. All content is fact-checked and reviewed by our editorial team to ensure accuracy and neutrality.