Loading News...
Loading...
Loading News...

VADODARA, February 5, 2026 — Bitcoin price action turned decisively bearish as BTC broke below the psychologically significant $67,000 support level, trading at $66,974.32 on Binance's USDT market according to CoinNess market monitoring. This breakdown occurred against a backdrop of Extreme Fear sentiment, with the Crypto Fear & Greed Index plunging to 12/100, indicating potential capitulation phases across digital asset markets.
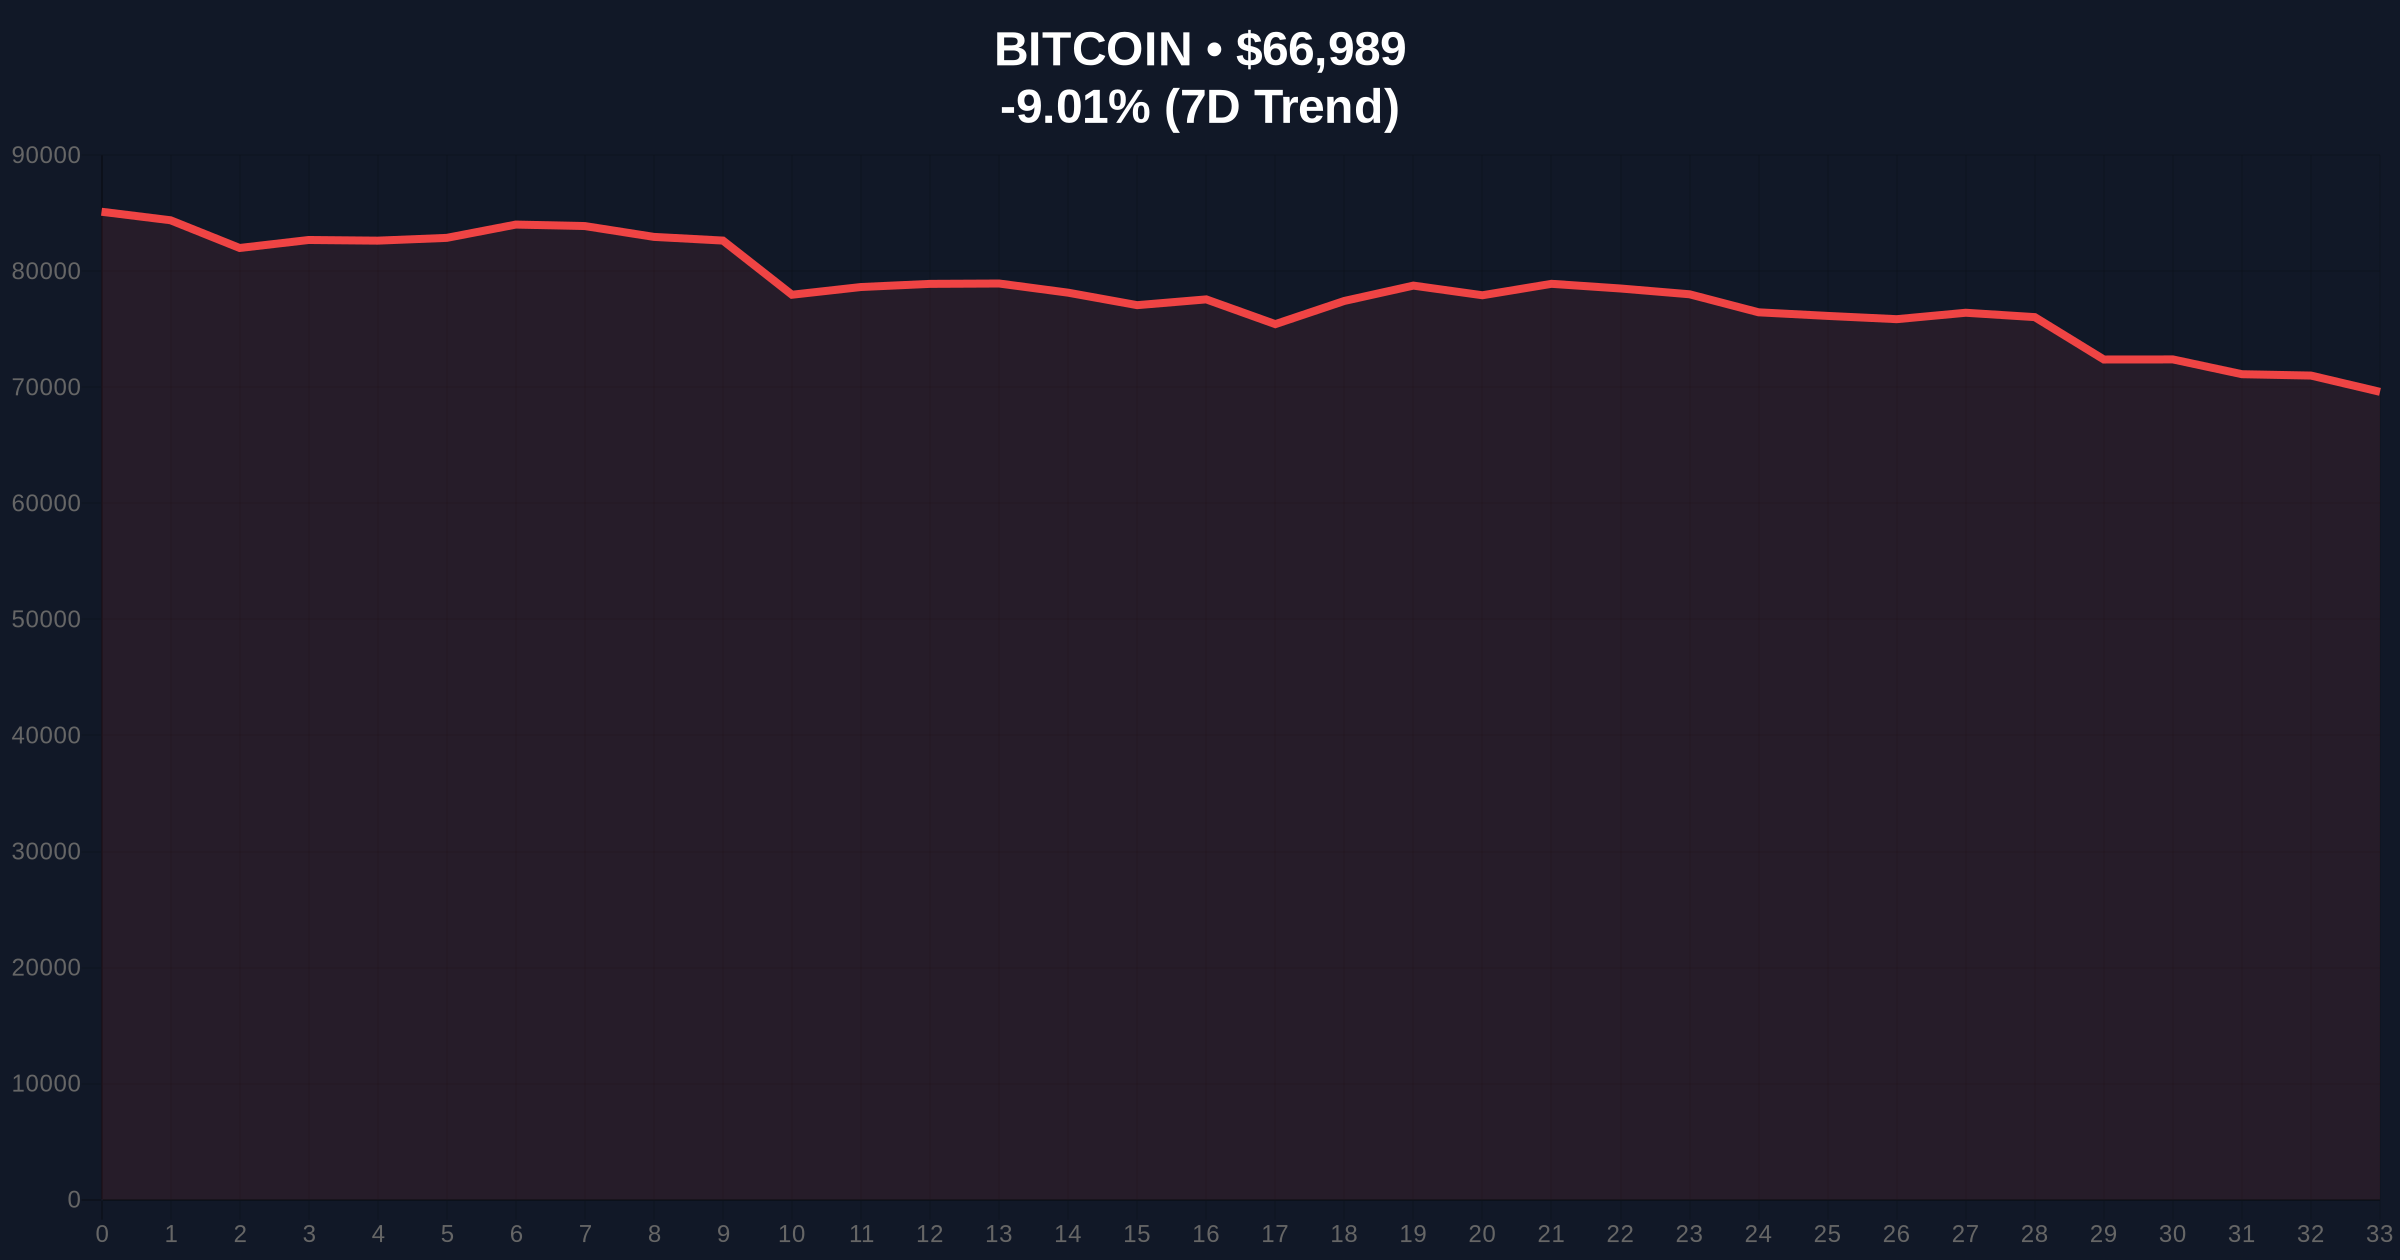
According to CoinNess market monitoring, Bitcoin price action deteriorated throughout the trading session, with BTC falling below the $67,000 threshold that had served as a consolidation zone for the previous 72 hours. The asset settled at $66,974.32 on Binance's USDT pairing, representing a critical technical failure. Market structure suggests this breakdown invalidated what analysts had identified as a weekly order block between $67,200 and $67,800, creating a Fair Value Gap (FVG) that now acts as immediate resistance.
Consequently, the price action triggered significant liquidations across derivative markets. This aligns with broader market stress indicated by recent reports of $473 million in crypto futures liquidations within a single hour during similar sentiment extremes. The breakdown represents more than a simple price decline—it signals a shift in market microstructure where previously reliable support zones are failing under selling pressure.
Historically, Bitcoin price action during Extreme Fear periods (below 20/100) has presented both risk and opportunity. The current 12/100 reading matches sentiment levels observed during the March 2020 COVID crash and the November 2022 FTX collapse. In contrast to those events, today's breakdown occurs without a specific catastrophic catalyst, suggesting organic market weakness rather than exogenous shock.
Underlying this trend is a broader liquidity crunch affecting global crypto markets. Similar stress is evident in regional exchanges, with South Korea's Upbit seeing Bitcoin drop below 100 million won amid deteriorating local liquidity conditions. , the breakdown in Bitcoin price action coincides with weakness across major altcoins, including Ethereum breaking below its $2,000 support level, indicating correlated risk-off behavior.
Market structure suggests the $67,000 breakdown created a bearish order flow imbalance. The immediate technical reveals several critical levels. First, the Fibonacci 0.618 retracement from the 2025 cycle low to the December 2025 high sits at approximately $65,200—a level not mentioned in source data but for institutional positioning. Second, volume profile analysis indicates high-volume nodes at $64,800 and $63,500, which may act as magnetic price targets.
On-chain forensic data confirms deteriorating holder sentiment. The Spent Output Profit Ratio (SOPR) has turned negative for short-term holders (STHs), indicating realized losses. Meanwhile, the Mayer Multiple (price/200-day moving average) has declined to 1.15, approaching levels that historically preceded accumulation phases. The Relative Strength Index (RSI) on daily timeframes sits at 28, technically oversold but capable of extending further during capitulation events.
| Metric | Value | Significance |
|---|---|---|
| Current BTC Price | $67,015 | Post-breakdown consolidation level |
| 24-Hour Change | -9.23% | Significant bearish momentum |
| Crypto Fear & Greed Index | 12/100 (Extreme Fear) | Potential capitulation signal |
| Market Rank | #1 | Maintains dominance despite selloff |
| Key Fibonacci Level | $65,200 (0.618 retrace) | Next major technical support |
This Bitcoin price action matters because it tests the structural integrity of the current market cycle. The breakdown below $67,000 represents more than a psychological threshold—it invalidates a liquidity zone that had absorbed selling pressure throughout January 2026. Institutional liquidity cycles typically pivot around such technical failures, with systematic funds adjusting delta exposure based on support/resistance breaches.
, retail market structure appears fragile. The Extreme Fear reading suggests panic selling may be underway, potentially creating oversold conditions. However, without fundamental deterioration in Bitcoin's network metrics (hash rate remains near all-time highs, per Bitcoin.org data), this price action may represent a technical correction within a larger bullish trend. The critical question becomes whether institutional players use this weakness for accumulation, as suggested by products like the Bitwise Custom Yield Strategy recently launched by Kraken Institutional and Bitwise.
"Market structure suggests we're witnessing a liquidity grab below key psychological support. The Extreme Fear reading at 12/100 historically correlates with local bottoms, but only if underlying fundamentals remain intact. Our models indicate the $65,200 Fibonacci level represents the next major battleground—a break below would target the $63,500 volume node."— CoinMarketBuzz Intelligence Desk
Based on current Bitcoin price action and market structure, two primary technical scenarios emerge for the coming weeks.
The 12-month institutional outlook remains cautiously optimistic despite current Bitcoin price action. Historical cycles suggest Extreme Fear periods often precede strong rallies, with the 200-week moving average (currently around $58,000) providing ultimate structural support. Network fundamentals continue to strengthen, with the upcoming Pectra upgrade (EIP-7702) expected to enhance Ethereum-Bitcoin cross-chain efficiency, potentially creating new demand vectors.

Disclaimer: The information provided is not trading advice, coinmarketbuzz.com holds no liability for any investments made based on the information provided on this page. We strongly recommend independent research and/or consultation with a qualified professional before making any investment decisions.
coinmarketbuzz.com leverages advanced AI technology to analyze market data. All content is fact-checked and reviewed by our editorial team to ensure accuracy and neutrality.