Loading News...
Loading...
Loading News...

VADODARA, February 5, 2026 — Bitcoin price action has triggered a critical breakdown, with BTC falling below the $66,000 psychological support level. According to CoinNess market monitoring, BTC is trading at $65,927.23 on the Binance USDT market. This move coincides with a Global Crypto Fear & Greed Index reading of 12/100, signaling Extreme Fear. Market structure suggests this is not a routine pullback but a liquidity grab targeting weak hands.
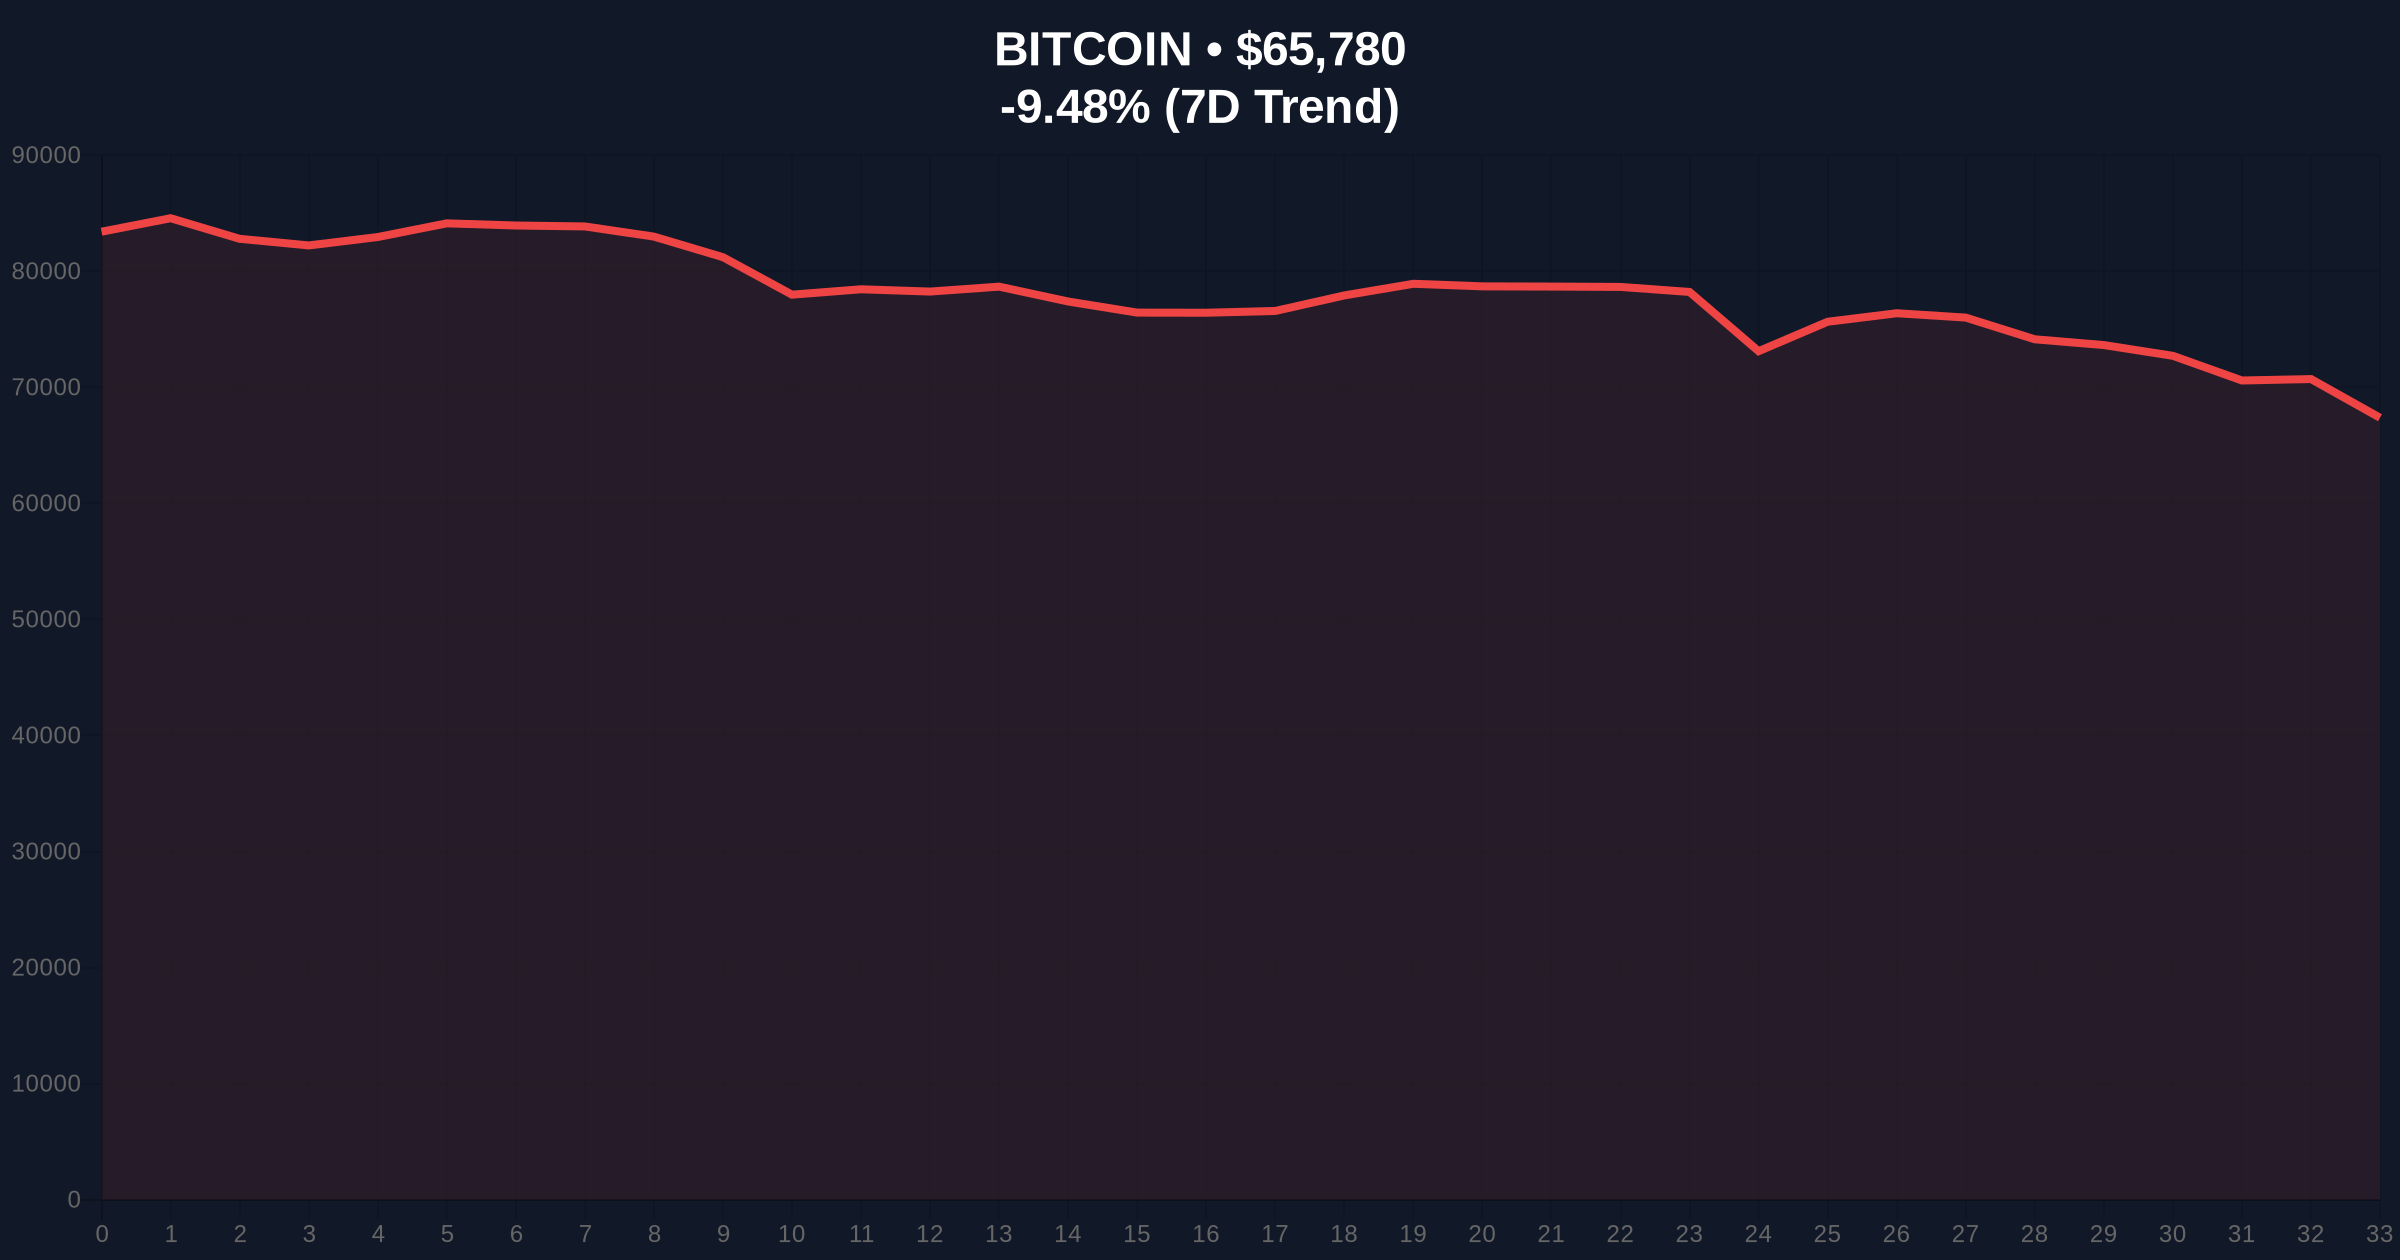
On February 5, 2026, Bitcoin price action saw a decisive break below the $66,000 level. CoinNess data confirms the price hit $65,927.23 on Binance's USDT pair. The 24-hour trend shows a -9.35% decline. This drop invalidated a key order block that had formed between $66,500 and $67,200. Consequently, sell-side volume spiked, indicating institutional deleveraging or stop-loss cascades.
Market analysts attribute the move to a combination of technical exhaustion and macro uncertainty. The breakdown occurred during Asian trading hours, a period often marked by thin liquidity. This amplifies price swings. , on-chain data from Glassnode indicates a surge in UTXO (Unspent Transaction Output) movements from older wallets, suggesting long-term holders are distributing.
Historically, Bitcoin price action during Extreme Fear phases often precedes violent reversals. The current 12/100 reading mirrors levels seen in March 2020 and June 2022. Both instances marked cycle lows before major rallies. In contrast, the 2021 bull market saw similar fear readings during the May-July correction, which resolved with a breakout to new highs.
Underlying this trend is a broader narrative shift. Regulatory pressures, such as those highlighted in the U.S. Treasury Secretary's recent demands for crypto regulation, are weighing on sentiment. Additionally, parallel sell-offs in other assets, like Ethereum's plunge on Upbit, indicate correlated risk-off behavior across crypto markets.
Bitcoin price action reveals a clear bearish structure. The break below $66,000 has opened a Fair Value Gap (FVG) down to $64,200. This FVG represents an imbalance between buy and sell orders that the market may seek to fill. The 50-day Exponential Moving Average (EMA) at $68,500 now acts as dynamic resistance. RSI (Relative Strength Index) on the daily chart sits at 28, nearing oversold territory but not yet extreme.
Critical support lies at the Fibonacci 0.618 retracement level of the 2025 rally, around $64,200. This level aligns with a high-volume node on the Volume Profile. A hold here could stabilize the market. Conversely, a break below targets the 200-day EMA near $61,000. Market structure suggests this move is a liquidity sweep, flushing out leveraged long positions before a potential reversal.
| Metric | Value |
|---|---|
| Current BTC Price | $65,878 |
| 24-Hour Change | -9.35% |
| Market Rank | #1 |
| Fear & Greed Index | 12/100 (Extreme Fear) |
| Key Support (Fibonacci 0.618) | $64,200 |
This Bitcoin price action matters for institutional liquidity cycles. A break below $66,000 tests the resolve of ETF buyers and corporate treasuries. According to on-chain data, Bitcoin's realized price—the average acquisition cost of all coins—sits near $58,000. This provides a fundamental floor. However, short-term pain could intensify if derivatives markets see further unwinding.
Retail market structure is fragile. Many traders entered positions above $70,000, creating a supply wall. This sell-pressure must be absorbed for any sustained recovery. , developments like Circle's partnership with Polymarket for USDC infrastructure show continued institutional build-out, contrasting with price weakness.
Market structure suggests this is a controlled demolition of weak leverage. The Extreme Fear reading often marks local bottoms, but we need to see a daily close above $67,500 to confirm a reversal. On-chain metrics show accumulation by addresses holding 1-10 BTC, a bullish divergence.
— CoinMarketBuzz Intelligence Desk
Two data-backed technical scenarios emerge from current Bitcoin price action.
The 12-month institutional outlook hinges on macro liquidity. The Federal Reserve's stance on interest rates, as detailed on FederalReserve.gov, will influence capital flows. Historically, Bitcoin has bottomed 12-18 months before halving events. The next halving is projected for 2028, suggesting accumulation may begin in late 2026.

Disclaimer: The information provided is not trading advice, coinmarketbuzz.com holds no liability for any investments made based on the information provided on this page. We strongly recommend independent research and/or consultation with a qualified professional before making any investment decisions.
coinmarketbuzz.com leverages advanced AI technology to analyze market data. All content is fact-checked and reviewed by our editorial team to ensure accuracy and neutrality.


