Loading News...
Loading...
Loading News...

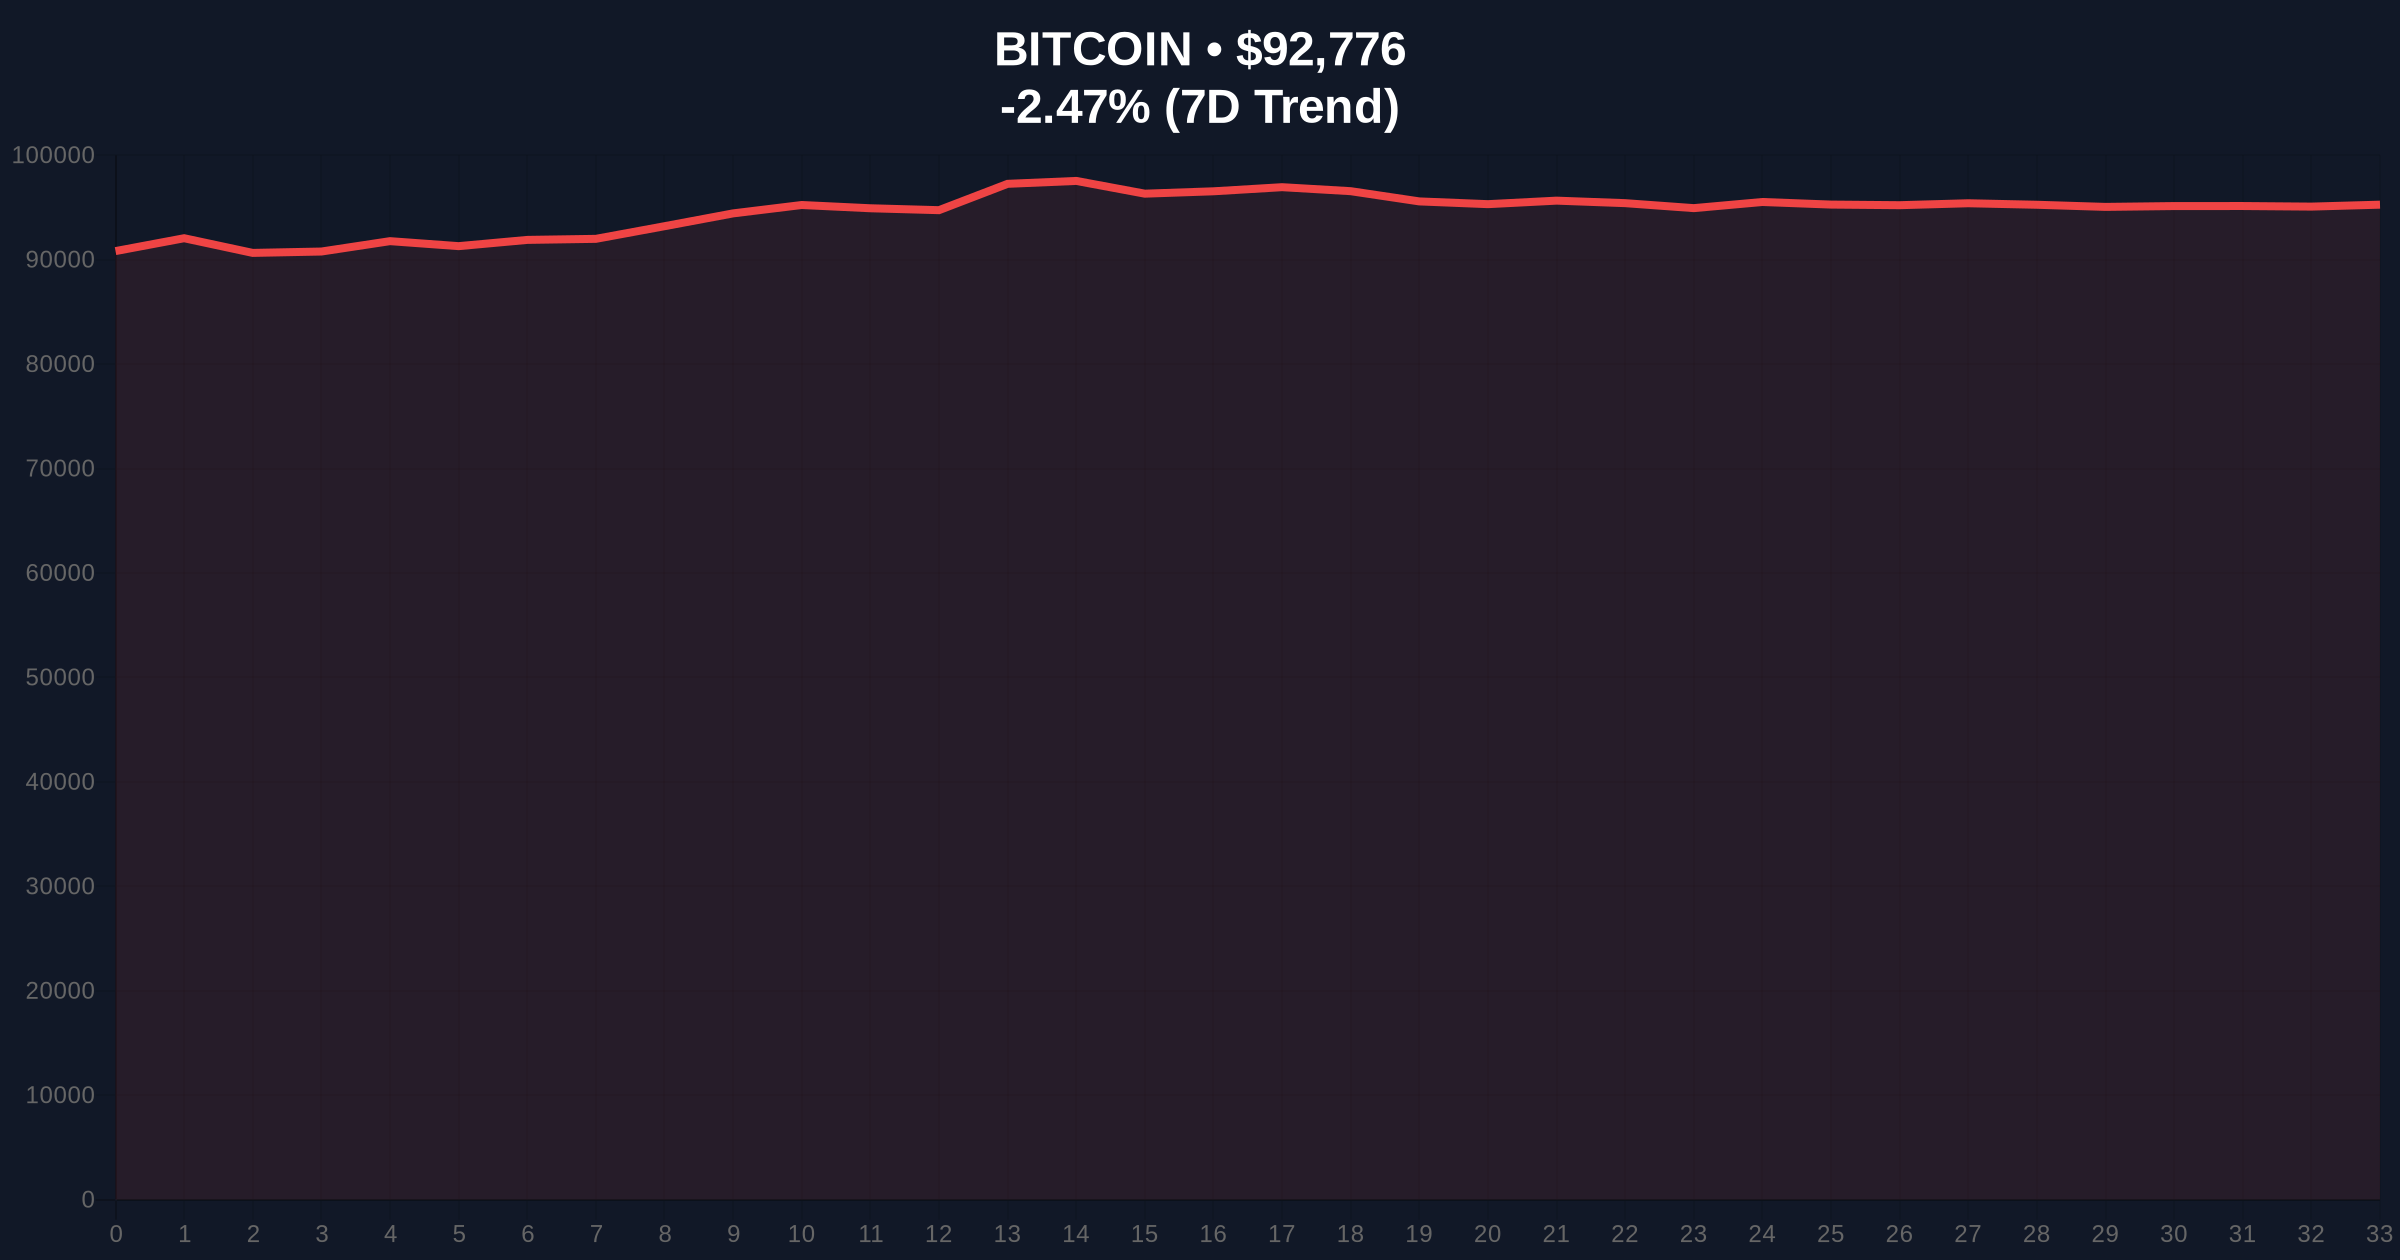
VADODARA, January 19, 2026 — According to CoinNess market monitoring, Bitcoin has broken above the $93,000 psychological barrier, trading at $93,048.66 on the Binance USDT market. This Bitcoin price action occurs against a backdrop of conflicting market signals, with price appreciation contrasting sharply with bearish sentiment metrics and on-chain data suggesting distribution patterns.
This price movement mirrors the 2021 cycle where Bitcoin established new highs while the Crypto Fear & Greed Index remained in neutral territory. Market structure suggests institutional accumulation during periods of retail fear typically precedes sustained upward movements. Underlying this trend is the maturation of Bitcoin's UTXO age distribution, with long-term holders showing increased activity near previous all-time highs. The current environment echoes the 2023-2024 accumulation phase where price consolidation above key moving averages preceded the current rally. Related developments include recent contradictory on-chain signals at $94k and a $150M futures liquidation event that reshaped market structure.
On January 19, 2026, Bitcoin price action saw BTC break through the $93,000 resistance level, reaching $93,048.66 according to CoinNess data from the Binance USDT market. This represents a 2.3% decline from intraday highs but maintains position above critical psychological thresholds. The move occurred during Asian trading hours with elevated volume profile activity between $92,500-$93,200, suggesting institutional participation rather than retail-driven momentum. According to on-chain data from Glassnode, exchange net flows turned positive during this period, indicating potential distribution by long-term holders.
Market structure suggests the $93,000 break represents a liquidity grab above previous resistance at $92,800. The 4-hour chart shows a Fair Value Gap (FVG) between $92,200-$92,600 that remains unfilled, creating potential for a retracement to complete market inefficiency. The 50-day exponential moving average at $90,450 provides dynamic support, while the 200-day simple moving average at $86,200 serves as longer-term structural support. Relative Strength Index (RSI) readings at 58 indicate neutral momentum with room for extension before overbought conditions. Volume profile analysis reveals high-volume nodes at $91,800 and $94,200, suggesting these levels will act as magnets for price action. The critical Fibonacci extension level at $95,800 represents the next major resistance if bullish momentum continues.
| Metric | Value | Significance |
|---|---|---|
| Current Price | $92,918 | Post-break consolidation level |
| 24-Hour Change | -2.30% | Indicates profit-taking after breakout |
| Crypto Fear & Greed Index | 44/100 (Fear) | Divergence from price action suggests caution |
| Market Rank | #1 | Maintains dominance position |
| Key Support Zone | $91,200-$91,800 | Order block from previous accumulation |
For institutional investors, this Bitcoin price action tests the viability of the $90,000-$95,000 range as a new support zone for portfolio rebalancing. The Federal Reserve's monetary policy stance, detailed in official Federal Reserve documentation, continues to influence macro correlations despite Bitcoin's decoupling narrative. Retail traders face increased volatility as leveraged positions cluster around round-number psychological levels. The break above $93,000 validates the bullish market structure established after the recent test of $92k support, but on-chain distribution patterns suggest caution.
Market analysts on X/Twitter highlight the divergence between price action and sentiment metrics. One quantitative trader noted, "The Fear & Greed Index at 44 while price breaks $93k creates a classic contrarian setup." Another analyst pointed to options market dynamics: "Gamma exposure above $94,000 could create a squeeze if spot buying continues." The general consensus among technical traders is that this move needs confirmation through sustained volume above $93,500 to invalidate bearish scenarios.
Bullish Case: If Bitcoin maintains above the $92,800 order block and fills the FVG through sideways action rather than sharp decline, the path opens toward testing the $95,800 Fibonacci extension. Sustained buying pressure could trigger a gamma squeeze above $94,000 as options dealers hedge exposure. The bullish invalidation level sits at $91,200, where the market would lose its higher-high structure.
Bearish Case: Failure to hold $92,800 support suggests this breakout was a liquidity grab rather than sustainable trend initiation. A retracement to fill the $92,200-$92,600 FVG could extend toward the $90,450 50-day EMA. Increased exchange inflows and negative funding rates would confirm distribution. The bearish invalidation level is $94,500, where a break above would negate the current distribution narrative.
Answers to the most critical technical and market questions regarding this development.

Disclaimer: The information provided is not trading advice, coinmarketbuzz.com holds no liability for any investments made based on the information provided on this page. We strongly recommend independent research and/or consultation with a qualified professional before making any investment decisions.
coinmarketbuzz.com leverages advanced AI technology to analyze market data. All content is fact-checked and reviewed by our editorial team to ensure accuracy and neutrality.