Loading News...
Loading...
Loading News...

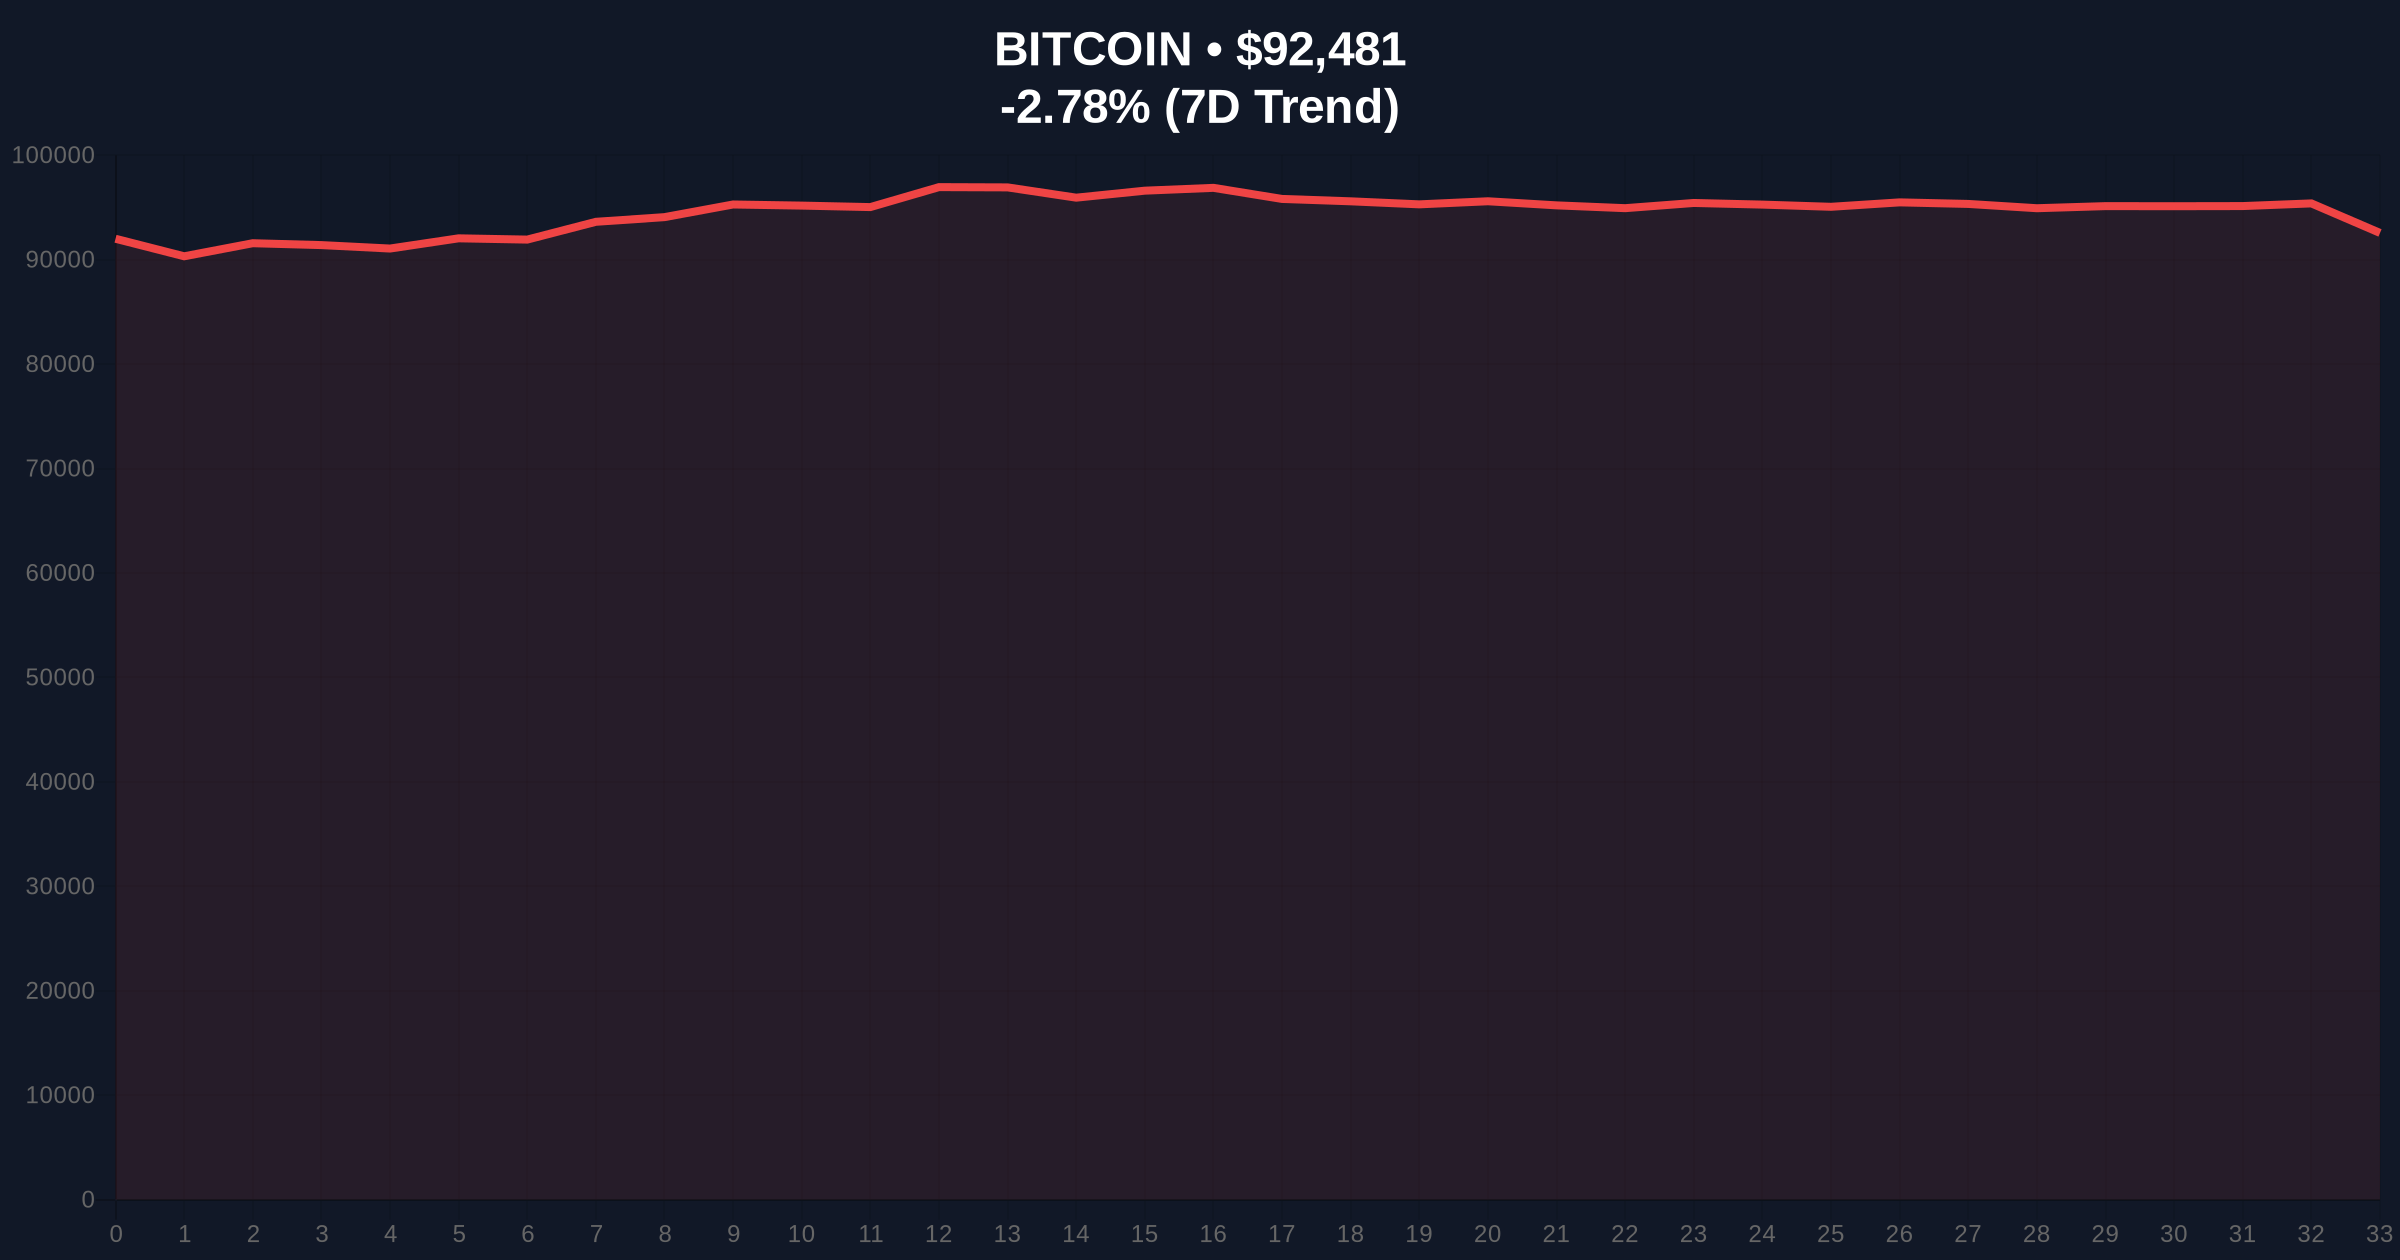
VADODARA, January 19, 2026 — Bitcoin perpetual futures data reveals a marginal short bias across top exchanges, with an aggregate ratio of 49.13% long to 50.87% short, coinciding with a 2.79% price drop to $92,469. This daily crypto analysis examines the underlying market mechanics and their implications for near-term price action.
Perpetual futures markets serve as a real-time sentiment gauge, with long/short ratios often preceding liquidity events. Historical cycles suggest that ratios near parity, as seen currently, can precede volatility spikes. Underlying this trend is the broader macroeconomic sensitivity of Bitcoin, where shifts in Federal Reserve policy or geopolitical tensions, such as recent tariff announcements, have triggered cascading liquidations. For instance, a recent analysis of Bitcoin price action highlighted how macro events can lead to significant market dislocations. The current data aligns with patterns observed during previous consolidation phases, where minor positioning imbalances often resolve through sharp moves to capture liquidity.
According to on-chain data from Coinness, the BTC perpetual futures long/short ratios over the last 24 hours show a slight lean toward short positions on the top three exchanges by open interest. The aggregate ratio is 49.13% long to 50.87% short. Exchange-specific breakdowns indicate: Binance at 49.31% long / 50.69% short, OKX at 48.38% long / 51.62% short, and Bybit at 49.55% long / 50.45% short. This data, sourced from exchange APIs and aggregated by analytics platforms, reflects real-time trader positioning without significant deviation from equilibrium.
Market structure suggests Bitcoin is testing a critical support zone near $92,000, with the 24-hour decline of 2.79% indicating selling pressure. The Relative Strength Index (RSI) on daily charts is approaching oversold territory, potentially signaling a near-term bounce. However, the 50-day moving average at $94,500 acts as immediate resistance. A Fair Value Gap (FVG) exists between $93,500 and $94,000, which may attract price to fill this liquidity void. Bullish invalidation is set at $90,000—a break below this level would negate the current higher-low structure and target deeper supports. Bearish invalidation lies at $96,000, where a sustained move above could trigger a short squeeze. This technical setup mirrors patterns seen in other market shifts, such as the liquidity grab observed in Tron withdrawals.
| Metric | Value |
|---|---|
| Bitcoin Current Price | $92,469 |
| 24-Hour Price Change | -2.79% |
| Crypto Fear & Greed Index | 44 (Fear) |
| Aggregate Futures Long/Short Ratio | 49.13% Long / 50.87% Short |
| Binance Futures Ratio | 49.31% Long / 50.69% Short |
This slight short bias matters because it reflects institutional positioning ahead of potential volatility. For retail traders, it signals caution, as leveraged positions could face liquidation if price moves sharply. Institutionally, the data indicates hedge funds and large players are preparing for a liquidity grab, possibly targeting stop-loss orders below key supports. The impact is amplified by Bitcoin's role as a market bellwether; shifts here often cascade into altcoins, affecting broader cryptocurrency news narratives. According to Ethereum.org documentation on market mechanics, such futures imbalances can influence spot markets through arbitrage opportunities, creating feedback loops.
Market analysts on X/Twitter note the ratio's proximity to parity, with some suggesting it sets the stage for a gamma squeeze if price rebounds. Bulls argue the minor short bias is insignificant, pointing to historical data where similar ratios preceded rallies. Bears highlight the consistent selling pressure and link it to broader concerns, such as miner capitulation trends seen in recent Bitcoin hashrate declines. Overall, sentiment remains divided, but the Fear & Greed Index score of 44 prevailing caution.
Bullish Case: If Bitcoin holds above $90,000 and fills the FVG near $94,000, a rally toward $100,000 is plausible. This scenario would involve a short squeeze fueled by positive macro catalysts, such as favorable regulatory developments.
Bearish Case: A break below $90,000 could trigger a cascade of liquidations, targeting the next support at $85,000. This would align with the current short bias and exacerbate fear sentiment, potentially leading to a test of the 200-day moving average.
Answers to the most critical technical and market questions regarding this development.

Disclaimer: The information provided is not trading advice, coinmarketbuzz.com holds no liability for any investments made based on the information provided on this page. We strongly recommend independent research and/or consultation with a qualified professional before making any investment decisions.
coinmarketbuzz.com leverages advanced AI technology to analyze market data. All content is fact-checked and reviewed by our editorial team to ensure accuracy and neutrality.