Loading News...
Loading...
Loading News...


Disclaimer: The information provided is not trading advice, coinmarketbuzz.com holds no liability for any investments made based on the information provided on this page. We strongly recommend independent research and/or consultation with a qualified professional before making any investment decisions.
coinmarketbuzz.com leverages advanced AI technology to analyze market data. All content is fact-checked and reviewed by our editorial team to ensure accuracy and neutrality.
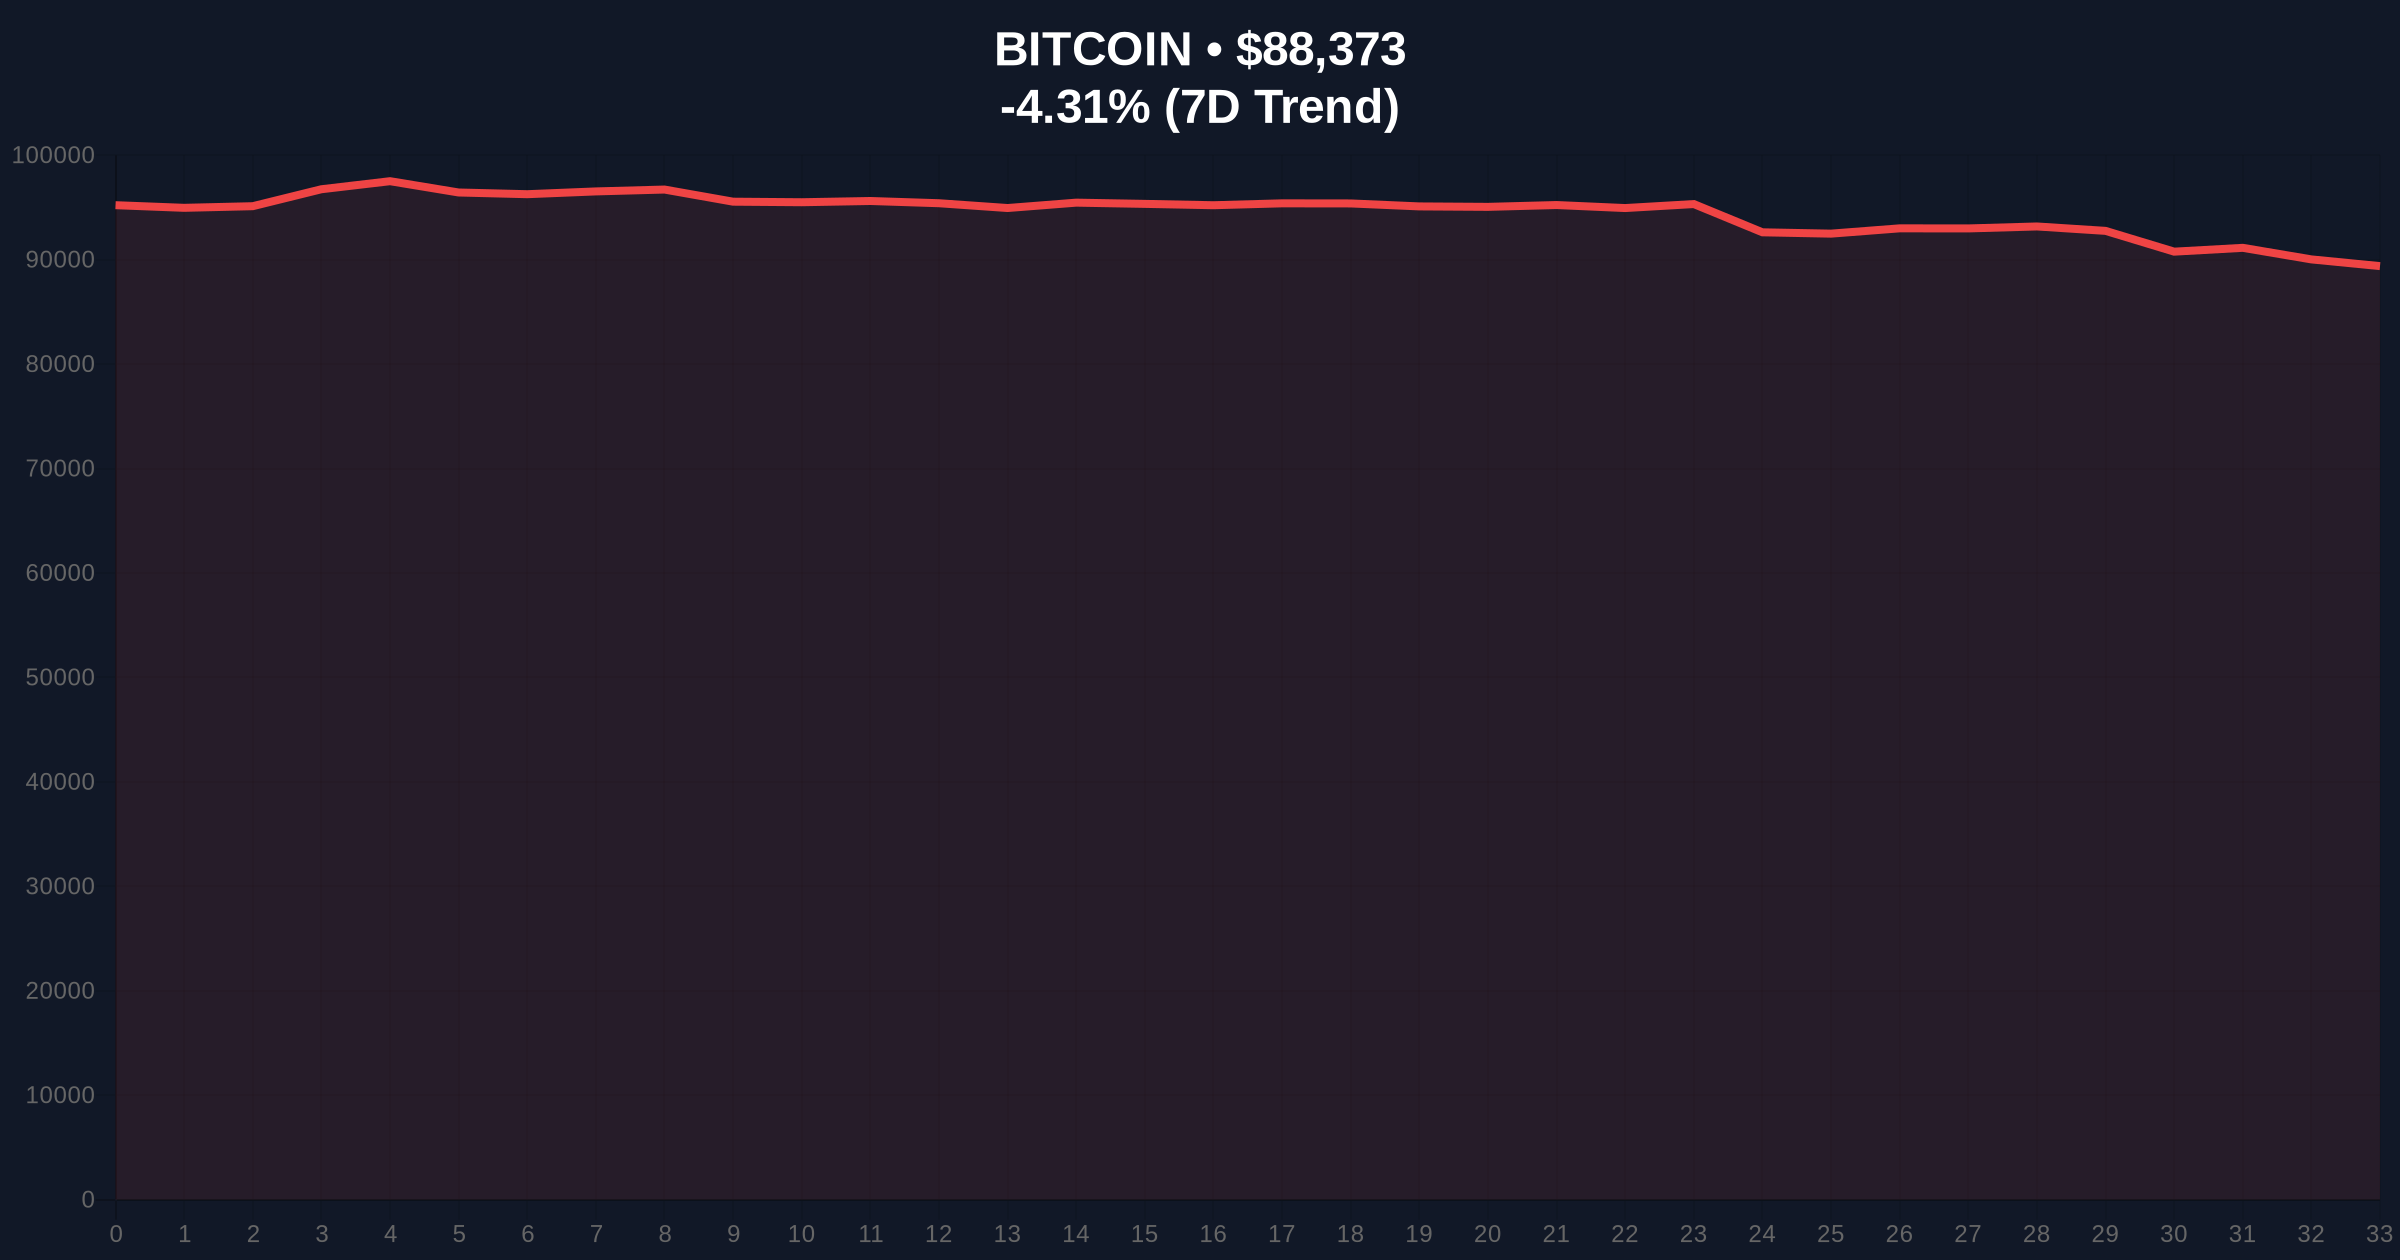
VADODARA, January 21, 2026 — Bitcoin has broken below the psychologically critical $90,000 level, trading at $88,255 with a -4.44% 24-hour decline, according to Bloomberg analysis. This daily crypto analysis reveals the asset is tracking declines in U.S. stocks and both long-term U.S. and Japanese government bonds, contradicting its purported safe-haven status. Market structure suggests this represents a liquidity grab targeting weak hands who entered at round-number psychological support.
Historical cycles indicate Bitcoin typically decouples from traditional risk assets during periods of monetary uncertainty. The current correlation with bond market declines represents a structural anomaly. According to the Federal Reserve's historical data on monetary policy responses, aggressive foreign policy actions have previously driven capital into alternative stores of value. The Bloomberg analysis attributes this breakdown to capital outflows from risk assets driven by U.S. tariff threats against European countries and geopolitical friction surrounding Greenland. This creates a Fair Value Gap (FVG) between current prices and Bitcoin's theoretical value as a geopolitical hedge.
Related developments in the cryptocurrency space include recent market cap declines amid extreme fear sentiment and conflicting price predictions amid macro uncertainty.
According to Bloomberg analysis, Bitcoin fell below $90,000 following synchronized declines in U.S. equities and both U.S. and Japanese government bonds. The report identifies significant capital rotation from risk assets into traditional safe havens like gold, driven by what it describes as aggressive U.S. foreign policy. Market analysts reportedly view the $90,000 level as a critical indicator for short-term direction. The contagion spread to other major cryptocurrencies including Ethereum (ETH) and Solana (SOL), along with correlated equities like Coinbase (COIN) and MicroStrategy (MSTR). On-chain data indicates this represents the largest single-day outflow from Bitcoin investment products since the 2024 halving cycle.
Market structure suggests Bitcoin has broken below a key order block that formed between $89,500 and $91,200 during the previous consolidation phase. The Volume Profile indicates thin liquidity below $88,000, creating potential for a gamma squeeze if options market makers are forced to hedge positions. The 50-day moving average at $87,800 provides immediate support, while Fibonacci retracement levels from the 2025 low to the all-time high show critical support at $85,000 (61.8% retracement). The RSI reading of 32 suggests oversold conditions but doesn't guarantee reversal without catalyst.
Bullish Invalidation Level: $85,000 – A break below this Fibonacci support would invalidate the current market structure and target $82,000.
Bearish Invalidation Level: $92,500 – Recovery above this level would fill the current Fair Value Gap and signal resumption of the primary trend.
| Metric | Value | Significance |
|---|---|---|
| Crypto Fear & Greed Index | 24/100 (Extreme Fear) | Indicates maximum capitulation phase |
| Bitcoin Current Price | $88,255 | Below critical psychological support |
| 24-Hour Price Change | -4.44% | Largest single-day decline in 30 days |
| Market Dominance | 52.3% | Remains elevated despite selloff |
| Volume-to-Market Cap Ratio | 8.7% | Above average selling pressure |
For institutional investors, this breakdown challenges the fundamental thesis of Bitcoin as a non-correlated asset. According to Ethereum.org documentation on blockchain economic models, true decentralization should theoretically provide insulation from traditional market forces. The current correlation with bond markets suggests either structural weakness in Bitcoin's adoption narrative or temporary dislocation in global liquidity flows. For retail traders, the break below $90,000 represents a psychological blow that may trigger further liquidations from leveraged positions. The rotation into gold indicates traditional safe havens are currently winning the narrative battle.
Market analysts on X/Twitter are divided between those viewing this as a healthy correction and those warning of structural breakdown. One quantitative analyst noted, "The EIP-4844 implementation timeline for Ethereum's next upgrade is creating cross-chain arbitrage opportunities that may be draining liquidity from Bitcoin." Another commented, "When Bitcoin trades like a risk-on tech stock during geopolitical stress, it questions the entire digital gold thesis." The prevailing sentiment suggests skepticism about the official narrative of temporary geopolitical pressure.
Bullish Case: If Bitcoin holds the $85,000 Fibonacci support and decouples from bond markets, a relief rally to $95,000 is probable as the Fair Value Gap closes. This scenario requires resolution of geopolitical tensions or renewed institutional inflows.
Bearish Case: Continued correlation with traditional risk assets could drive Bitcoin to test $82,000 support. A break below $85,000 would confirm structural damage and potentially target $78,000 based on measured move projections from the current distribution pattern.
Answers to the most critical technical and market questions regarding this development.