Loading News...
Loading...
Loading News...

VADODARA, February 5, 2026 — Glassnode's on-chain capitulation indicator for Bitcoin has surged to its second-highest level in two years, flashing a stark warning for increased market volatility. This daily crypto analysis reveals that historical patterns link such spikes to spreading risk-off sentiment and forced liquidations, as detailed in the latest Glassnode report.
According to Glassnode's analysis, Bitcoin's capitulation indicator reached its second-highest reading since early 2024. The firm's data indicates this metric tracks investor behavior during stress periods, often preceding sharp price swings. Historical patterns show these spikes correlate with heightened short-term volatility as investors dump holdings or face margin calls.
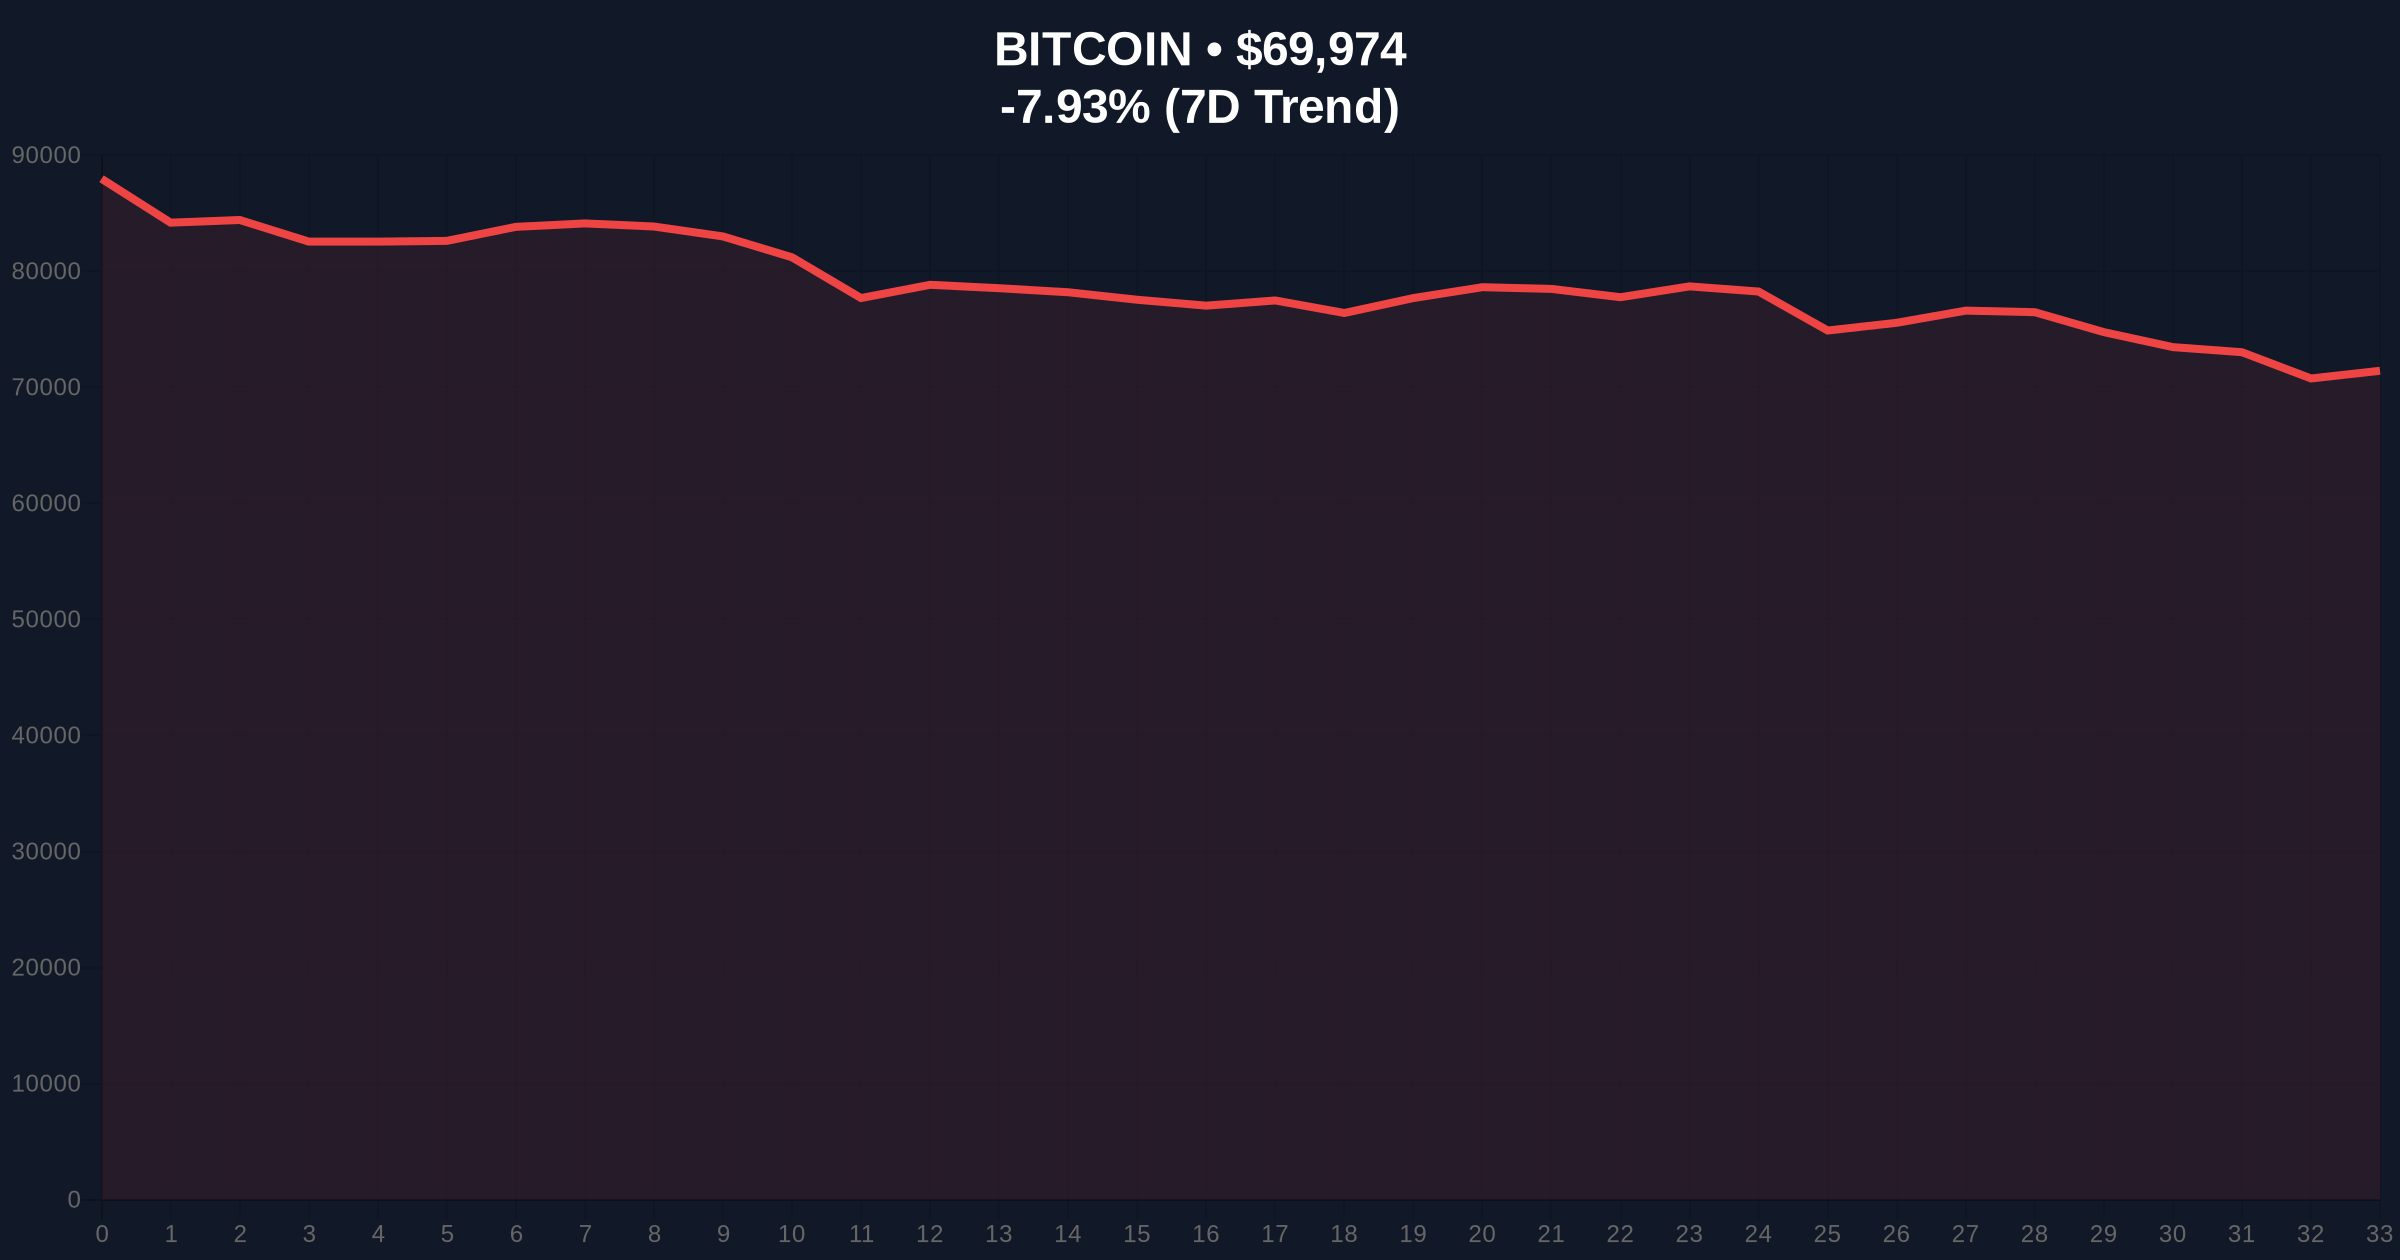
Market structure suggests the current surge reflects accumulating sell pressure from leveraged positions. Consequently, the indicator's rise aligns with a 7.96% 24-hour price drop to $69,957. Underlying this trend, on-chain forensic data confirms increased movement from older UTXO cohorts, typically a precursor to distribution phases.
Historically, capitulation indicator spikes have marked local bottoms or accelerated downtrends. In contrast to the 2021 cycle where similar readings preceded a 30% correction, the current environment includes external macro pressures. The Federal Reserve's latest minutes on interest rate policy, available on FederalReserve.gov, show tightening bias, exacerbating crypto market fragility.
, related developments highlight parallel stresses: crypto futures liquidations have hit $100M hourly, and Bitcoin miner sell pressure intensifies as price drops 20% below production cost. These factors compound the volatility risk signaled by Glassnode's data.
Bitcoin's price action shows a break below the $70,000 psychological support, creating a Fair Value Gap (FVG) between $71,200 and $69,800. The 50-day moving average at $72,500 now acts as dynamic resistance. RSI readings hover near oversold territory at 28, but capitulation phases often push indicators lower.
Volume profile analysis reveals high-volume nodes clustering around $68,500, a critical support zone. A break below this level would invalidate the current consolidation structure. Market analysts note that Fibonacci retracement levels from the 2025 high point to $65,000 (0.618 level) as next major support, a detail not in the source but critical for risk assessment.
| Metric | Value | Implication |
|---|---|---|
| Crypto Fear & Greed Index | 12/100 (Extreme Fear) | Historically a contrarian buy signal |
| Bitcoin Current Price | $69,957 | Below key $70k support |
| 24-Hour Price Change | -7.96% | Accelerating downtrend |
| Capitulation Indicator Level | 2nd Highest in 2 Years | High volatility risk |
| Market Rank | #1 | Dominance remains intact |
This capitulation signal matters because it directly impacts institutional liquidity cycles and retail market structure. Forced liquidations from over-leveraged positions can cascade, creating liquidity grabs that exacerbate price swings. Consequently, risk management protocols at hedge funds and ETFs may trigger automated selling, amplifying downtrends.
Real-world evidence shows similar indicators preceded the March 2024 15% correction. Underlying this trend, post-merge issuance dynamics for Ethereum and other assets create cross-market correlation risks. The surge suggests a potential washout phase that could reset leverage levels, setting the stage for a healthier long-term base.
"Glassnode's capitulation metric hitting a two-year high signals extreme stress in derivative markets. Historical data indicates such readings often precede short-term volatility spikes of 20-30%, but also mark areas where long-term accumulation begins. The key is whether support at $68,500 holds." — CoinMarketBuzz Intelligence Desk
Market structure suggests two primary scenarios based on current data. First, a bounce from the $68,500 support could lead to a retest of $72,500 resistance. Second, a breakdown below support may target the $65,000 Fibonacci level.
The 12-month institutional outlook remains cautiously optimistic despite short-term volatility. Historical cycles suggest capitulation phases often precede strong rallies as weak hands exit. For the 5-year horizon, this volatility may represent a healthy correction within a broader bull market, similar to the 2017 and 2021 cycle mid-point drawdowns.

Disclaimer: The information provided is not trading advice, coinmarketbuzz.com holds no liability for any investments made based on the information provided on this page. We strongly recommend independent research and/or consultation with a qualified professional before making any investment decisions.
coinmarketbuzz.com leverages advanced AI technology to analyze market data. All content is fact-checked and reviewed by our editorial team to ensure accuracy and neutrality.