Loading News...
Loading...
Loading News...

VADODARA, February 5, 2026 — Bitcoin has decisively broken below the $64,000 psychological support level. According to CoinNess market monitoring data, BTC currently trades at $63,709.36 on the Binance USDT market. This breakdown represents a critical technical failure. Market structure suggests increased selling pressure is overwhelming buy-side liquidity.
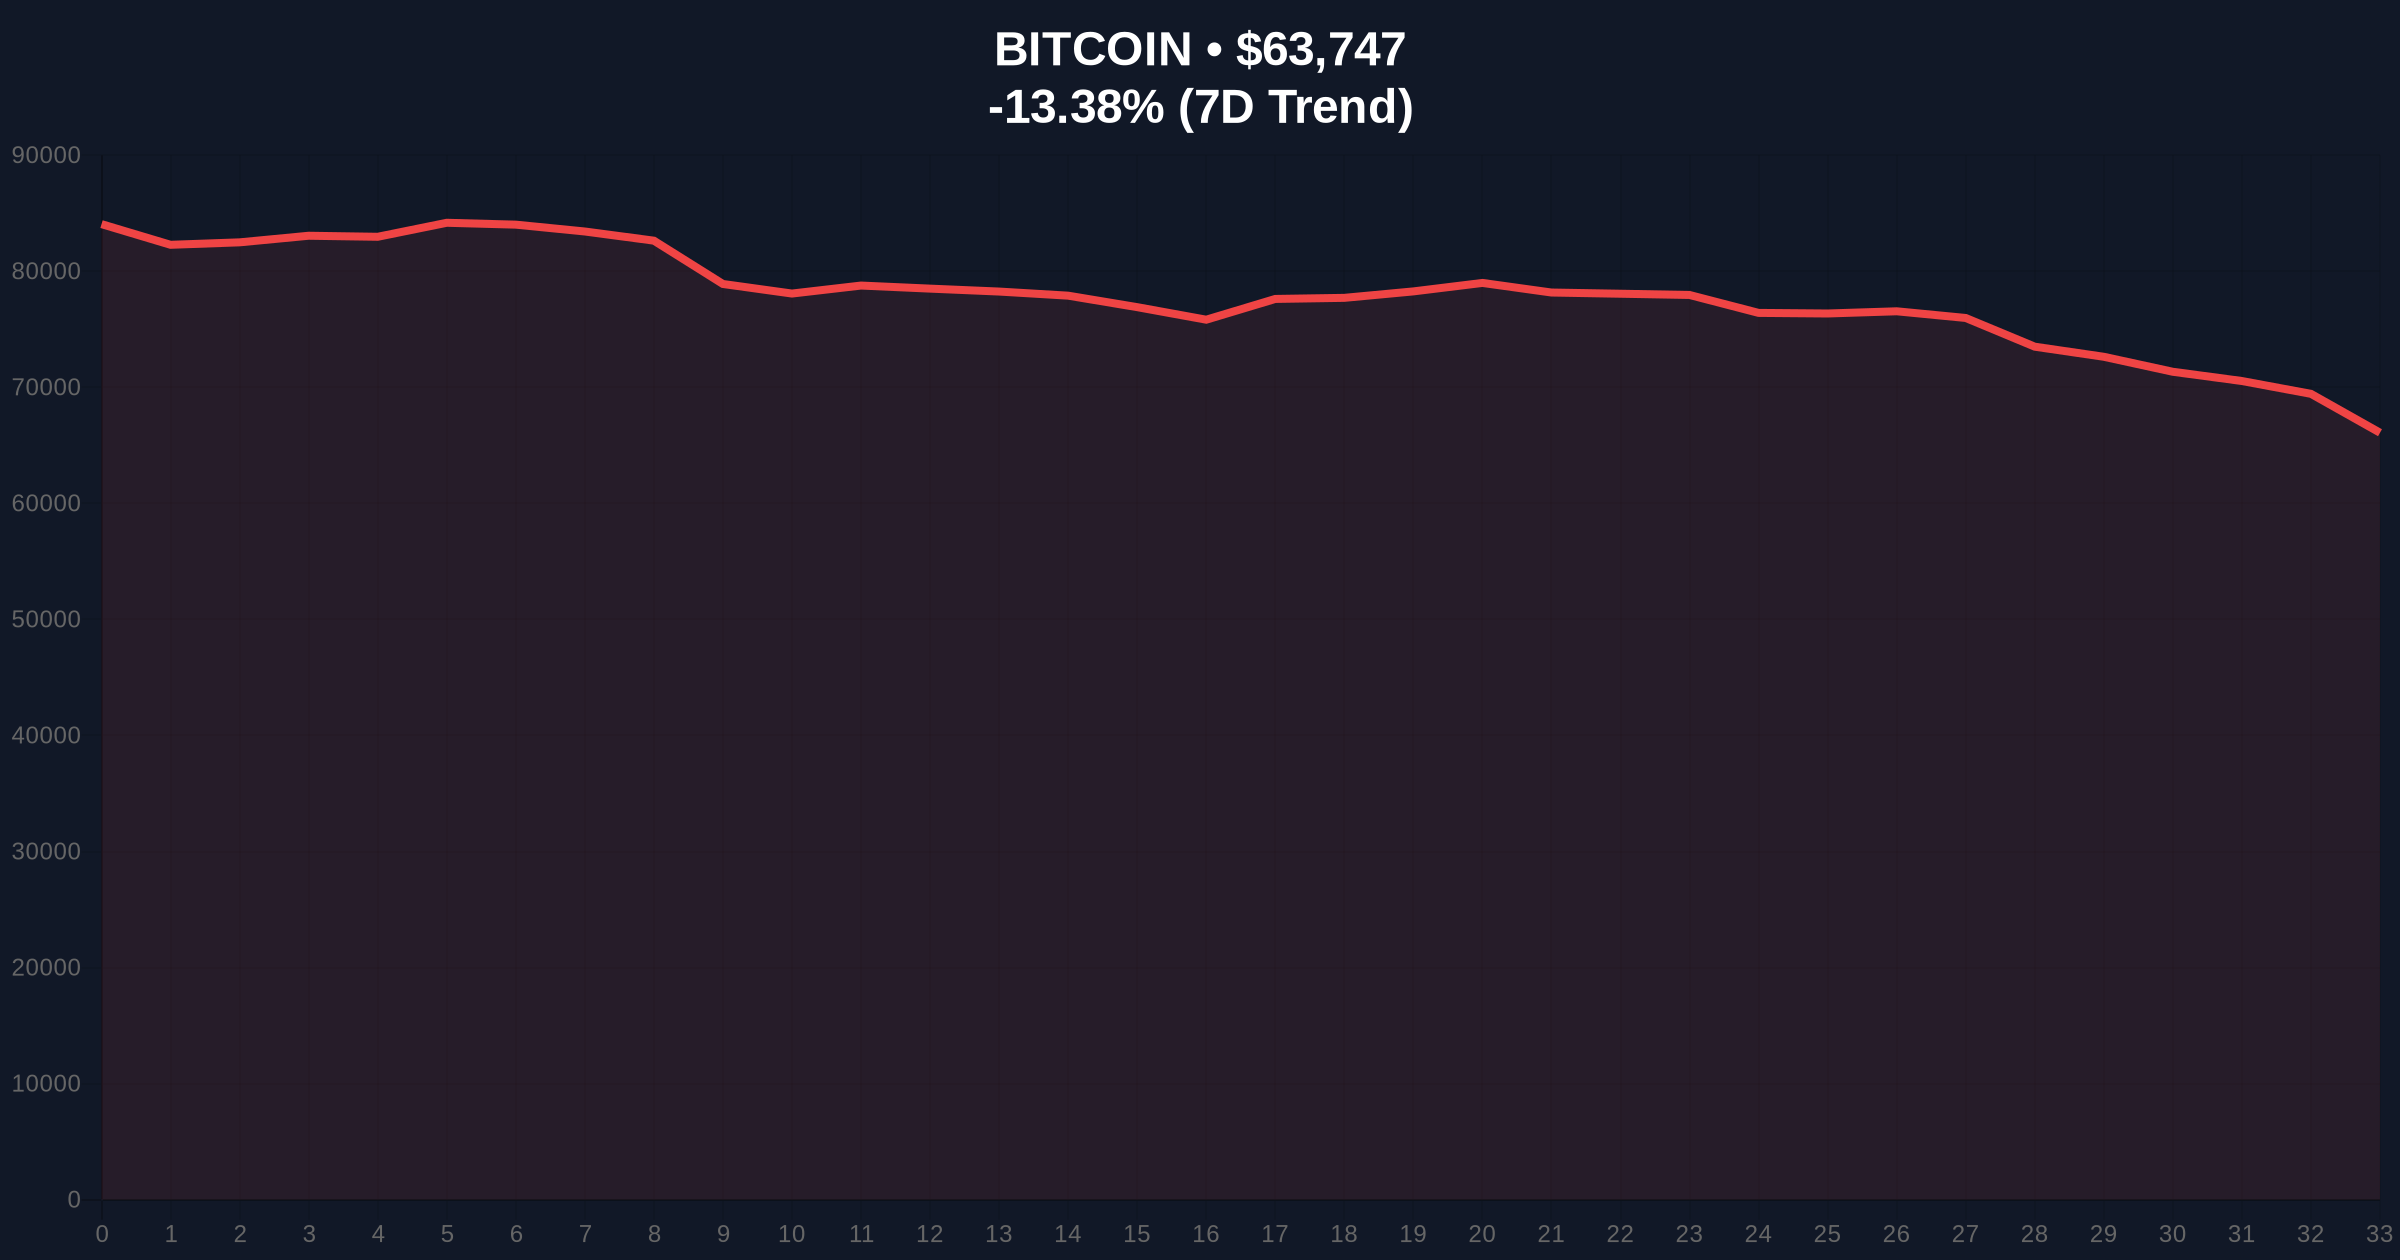
CoinNess market monitoring confirms the breakdown occurred during Asian trading hours. The Binance USDT market shows BTC trading at $63,709.36. This price action invalidates the $64,000 support zone that held throughout January 2026. On-chain data indicates significant volume transacted at this level. Consequently, its failure creates a substantial Fair Value Gap (FVG) between $63,800 and $64,200.
Market analysts attribute the move to several factors. First, leveraged long positions faced margin calls. Second, institutional profit-taking accelerated. Third, macroeconomic uncertainty persists. The breakdown aligns with historical patterns of February volatility. Glassnode liquidity maps show thinning bid support below $64,000.
Historically, February has been a volatile month for Bitcoin. In 2021, BTC corrected 21% during February. Similarly, 2022 saw a 17% decline. This current move mirrors those patterns. However, underlying fundamentals differ significantly. Spot Bitcoin ETF flows remain positive overall. Network hash rate continues hitting all-time highs.
In contrast to previous cycles, institutional participation is now dominant. According to the SEC's official ETF data, net inflows have exceeded $15 billion since January 2025. This creates a structural bid underneath the market. Nevertheless, short-term technicals are driving price action. The breakdown below $64,000 represents a liquidity grab by market makers.
Related developments include contradictory market signals. For instance, Bitcoin recently rallied above $68,000 despite extreme fear readings. Meanwhile, regulatory uncertainty persists in Washington. Additionally, Bitfinex margin longs hit a 2-year high just before this decline. , futures liquidations exceeded $102 million during the move.
Market structure suggests a clear bearish shift. The $64,000 level previously acted as a major Order Block. Its invalidation opens the path toward $62,800. This represents the Fibonacci 0.618 retracement from the December 2025 low. Volume Profile analysis shows high-volume nodes at $63,200 and $62,500. These levels will provide temporary support.
Relative Strength Index (RSI) readings now sit at 42 on the daily chart. This indicates neutral momentum with bearish bias. The 50-day moving average at $65,400 acts as resistance. The 200-day moving average at $58,900 provides longer-term support. On-chain metrics show UTXO age bands shifting. Older coins are moving to exchanges. This suggests long-term holders are distributing.
| Metric | Value | Significance |
|---|---|---|
| Current BTC Price | $63,709.36 | Below critical $64k support |
| Daily Price Change | -3.8% | Accelerating decline |
| Crypto Fear & Greed Index | 28 (Extreme Fear) | Contrarian signal potential |
| 24h Trading Volume | $42.7B | Above 30-day average |
| RSI (Daily) | 42 | Neutral with bearish bias |
This breakdown matters for several reasons. First, it tests institutional conviction. Spot ETF flows must absorb selling pressure. Second, it validates technical analysis frameworks. Support levels are proving meaningful. Third, it impacts derivative markets. Liquidations cascade through futures and options books.
Real-world evidence shows shifting market structure. Retail traders are capitulating. Meanwhile, institutions are accumulating at lower prices. This creates a transfer of wealth from weak to strong hands. The 5-year horizon remains bullish despite short-term pain. Network fundamentals continue improving. Adoption metrics show steady growth.
"The $64,000 breakdown represents a critical technical failure. Market structure suggests we're testing the resolve of long-term holders. However, on-chain data indicates accumulation by smart money at these levels. The key will be whether the $62,800 Fibonacci support holds. If it breaks, we could see a rapid move toward $60,000."— CoinMarketBuzz Intelligence Desk
Two primary scenarios emerge from current market structure. Both depend on critical price levels holding or breaking.
The 12-month institutional outlook remains constructive despite short-term weakness. Spot ETF adoption continues accelerating globally. Network upgrades like the upcoming Taproot activation improve Bitcoin's utility. Macroeconomic conditions may shift toward accommodative policies later in 2026. This could provide tailwinds for risk assets.

Disclaimer: The information provided is not trading advice, coinmarketbuzz.com holds no liability for any investments made based on the information provided on this page. We strongly recommend independent research and/or consultation with a qualified professional before making any investment decisions.
coinmarketbuzz.com leverages advanced AI technology to analyze market data. All content is fact-checked and reviewed by our editorial team to ensure accuracy and neutrality.