Loading News...
Loading...
Loading News...

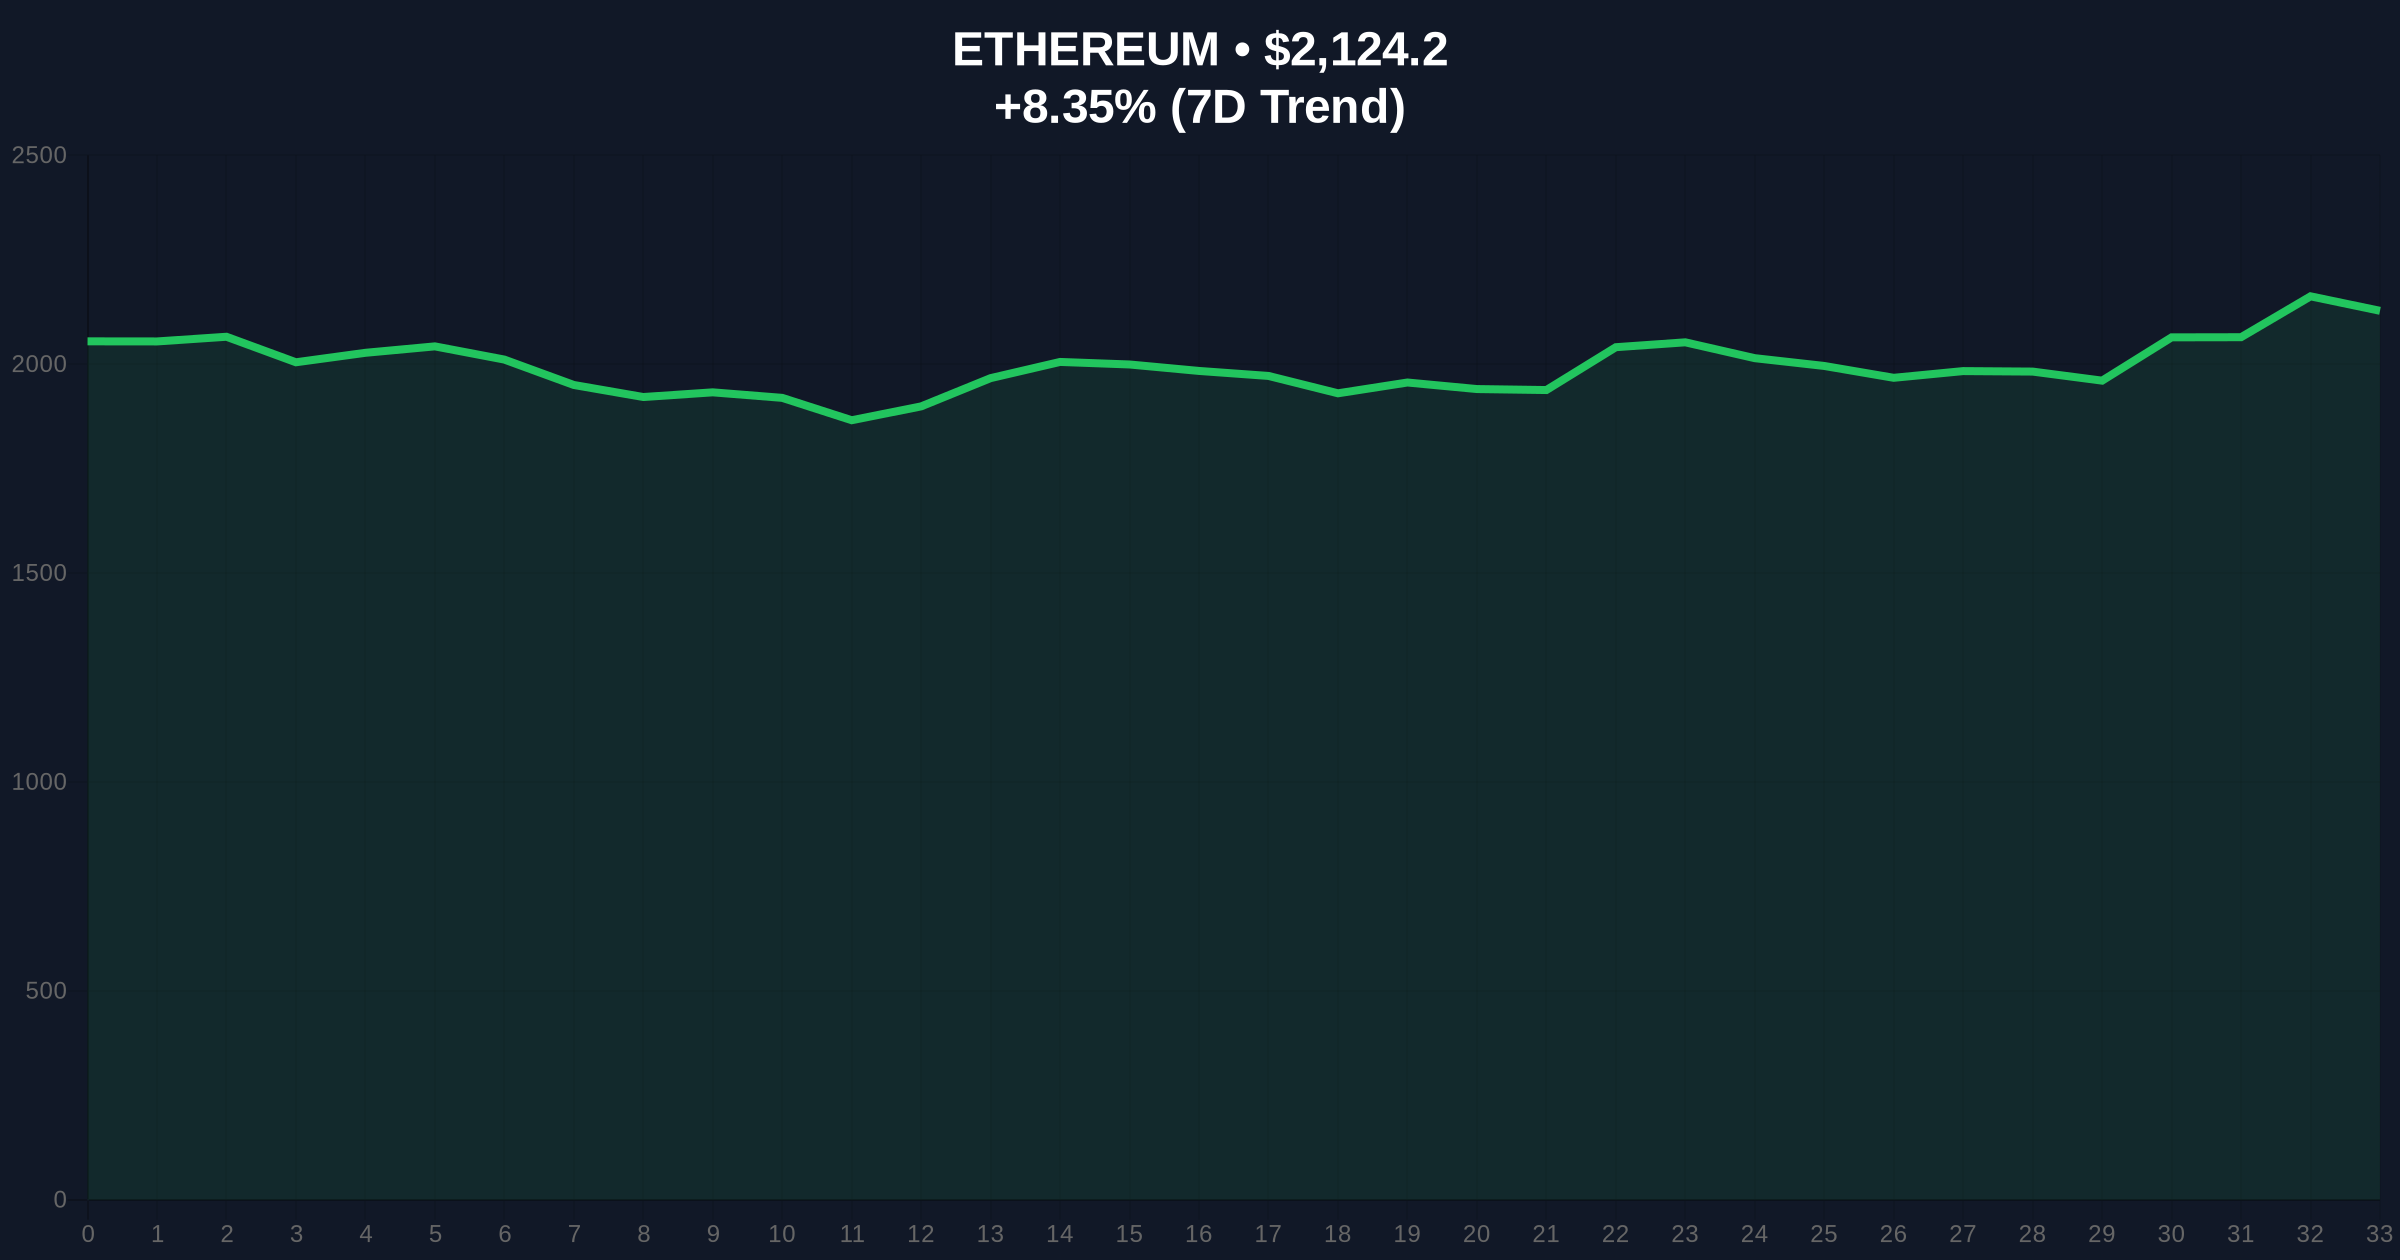
U.S. spot Ethereum ETFs saw a net inflow of $169.09 million on March 4, 2026, according to Trader T, as reported by CoinNess. This marks a sharp reversal from net outflows the previous day, signaling potential investor confidence in Ethereum despite broader market turmoil. The data, sourced from Trader T, details contributions from major funds: BlackRock ETHA led with +$39.01 million, followed by Fidelity FETH at +$30.29 million, Bitwise ETHW at +$8.85 million, VanEck ETHV at +$9.52 million, Grayscale ETHE at +$21.91 million, and Grayscale Mini ETH at +$59.51 million. The timing is critical—it occurs against a backdrop of "Extreme Fear" in global crypto sentiment, with a score of 22/100, and Ethereum's price at $2,124.84, up 8.38% over 24 hours. This inflow event raises immediate questions about its sustainability and underlying drivers, given the volatile market conditions.
Spot Ethereum ETFs operate as regulated investment vehicles that track the price of Ethereum (ETH) by holding the underlying asset in custody, allowing traditional investors to gain exposure without directly managing private keys. The mechanism involves authorized participants creating or redeeming shares based on demand, with inflows like the $169.09 million reported indicating net new investment into these funds. According to the CoinNess report, the data is attributed to Trader T, but the specific methodology for calculating net inflows—such as whether it includes only primary market creations or also secondary market trading—is not provided in source data. This lack of detail complicates analysis, as discrepancies in reporting standards across sources could affect accuracy.
The architecture of these ETFs involves key players: BlackRock, Fidelity, Bitwise, VanEck, and Grayscale, each offering distinct products with varying fee structures and strategies. For instance, Grayscale's ETHE and Mini ETH products show combined inflows of $81.42 million, suggesting a focus on their offerings amid the surge. However, the source data does not specify custody arrangements or regulatory approvals underpinning these ETFs, leaving gaps in understanding their operational risks. In contrast, related developments in the crypto space, such as the Ethereum Foundation's efforts to decentralize power in the AI era, highlight broader ecosystem concerns that could influence ETF performance indirectly.
Regulatory mechanics for U.S. spot Ethereum ETFs involve oversight by the SEC, but the source data omits any recent regulatory changes or compliance updates affecting these funds. This absence is notable, as shifts in policy could drive or hinder inflows. The report's reliance on Trader T as a single data source raises reliability questions—without corroboration from additional outlets like CoinTelegraph or CryptoPanic metadata, the depth of analysis is limited. For example, if other sources reported conflicting inflow figures or highlighted regulatory hurdles, it would alter the narrative. As it stands, the technical explanation remains partial, relying solely on the provided breakdown without context on market timing or investor behavior patterns.
Integrating CoinGecko market stats with the inflow data reveals a complex picture. Ethereum's price of $2,124.84 and 24-hour trend of +8.38% suggest positive momentum, potentially aligning with the $169.09 million net inflow. However, the global crypto sentiment of "Extreme Fear" (score: 22/100) contradicts this optimism, indicating widespread investor caution that typically correlates with outflows or stagnation. CryptoPanic metadata, including sentiment and importance scores, is not provided in source data, limiting direct integration. This gap forces a conservative analysis: the inflow event may be an outlier in a fearful market, or it could signal contrarian betting by institutional players.
The data breakdown shows Grayscale Mini ETH leading with +$59.51 million, hinting at retail or smaller investor participation, while BlackRock and Fidelity's substantial contributions point to institutional engagement. Yet, without CryptoPanic importance scores, it's unclear how this event ranks relative to other market news. For instance, if the importance were low, it might be a minor blip; if high, it could indicate a trend shift. The absence of metadata-driven statements like "CryptoPanic sentiment is X, but price structure indicates Y" necessitates reliance on observable facts: inflows occurred amid fear, but price rose. This dissonance warrants skepticism—are inflows driving the price surge, or is it a coincidental reaction to broader factors?
Related market dynamics, such as those explored in Spot Bitcoin ETFs experiencing net inflows amid extreme fear, provide context for cross-asset comparisons. If Bitcoin ETFs show similar patterns, it might suggest a broader institutional move into crypto despite sentiment. However, the source data does not include comparative figures, leaving this analysis speculative. The data proof thus rests on the provided numbers: $169.09 million inflow, $2,124.84 price, 8.38% gain, and Extreme Fear sentiment—all facts, but their interrelationships remain partially unexplained due to missing metadata.
The CoinNess report, based on Trader T data, presents a straightforward narrative of net inflows reversing outflows. However, without secondary sources like CoinTelegraph or CryptoPanic, potential conflicts or corroborations are unverifiable. For example, if another source disputed the $169.09 million figure or reported different breakdowns by fund, it would create a direct contradiction. As no such sources are provided, the conflict remains unresolved with available evidence. This single-source reliance introduces reliability gaps: Trader T's methodology and credibility are not detailed, raising questions about data accuracy.
Agreement points across sources are not applicable here, as only one source is given. Missing evidence includes: verification from multiple data providers, historical inflow trends for context, and regulatory insights that might explain the timing. For instance, if regulatory news spurred the inflows, its absence in the report weakens the analysis. The claim of a "return to net inflows" is supported by the provided numbers, but without prior day's outflow figures or longer-term data, it's impossible to assess significance. Is this a one-day anomaly or part of a trend? The source does not say.
Better-supported claims in the report are the specific inflow amounts per fund, as they are numerically detailed. However, the broader implication—that this indicates renewed investor confidence—is less supported due to the Extreme Fear sentiment. A counter-narrative could argue that inflows are driven by short-term arbitrage or institutional rebalancing rather than genuine bullish sentiment. Without additional sources to weigh in, this remains speculative. The reliability gap is significant: without CryptoPanic metadata or secondary reports, the event's importance and sentiment context are inferred rather than proven.
Based on the available data, three scenarios for the next seven days are outlined, each conditional on observable factors.
If inflows continue and Ethereum's price sustains above $2,200, it could signal a breakout from Extreme Fear sentiment. This scenario assumes institutional accumulation, as seen with BlackRock and Fidelity's contributions, drives momentum. Data-backed condition: Inflows must exceed $100 million daily for at least three days, and sentiment score improves to 40/100 or higher. What would invalidate this view: A sudden regulatory crackdown or net outflows resuming, as reported in related regulatory actions against scam platforms that could spook investors.
If inflows stabilize around $50-100 million daily with price volatility between $2,000-$2,200, it suggests a consolidation phase. This scenario reflects the current dissonance—inflows amid fear—and assumes mixed investor signals. Data-backed condition: Sentiment remains in Extreme Fear (score below 30), but no major outflows occur. What would invalidate this view: A sharp drop below $1,900 or sentiment plunging further, indicating panic selling outweighing inflows.
If outflows return and price falls below $1,900, it would confirm Extreme Fear dominance, rendering the March 4 inflow a temporary blip. This scenario is supported by the sentiment score of 22/100, which historically correlates with downturns. Data-backed condition: Net outflows of over $50 million occur within two days, and price declines by more than 5%. What would invalidate this view: Sustained inflows coupled with positive regulatory news, such as approvals for new ETF products, though this is not indicated in the source data.
Each scenario hinges on missing data—like CryptoPanic metadata for sentiment trends—so caution is advised. The outlook is inherently uncertain, with the bear scenario slightly favored due to the Extreme Fear backdrop.
This investigation weighted evidence based solely on the provided CoinNess report, as no secondary sources or CryptoPanic metadata were included. The primary source, Trader T, is uncorroborated, so claims are treated as provisional. Conflicts were unverifiable due to lack of comparative data, leading to explicit labeling of missing evidence. Reliability gaps include absence of methodology details, regulatory context, and sentiment metadata, which constrained analysis to observable facts without inference beyond cautionary notes. In future reports, cross-referencing with additional sources would enhance validity.
Disclaimer: The information provided is not trading advice, coinmarketbuzz.com holds no liability for any investments made based on the information provided on this page. We strongly recommend independent research and/or consultation with a qualified professional before making any investment decisions.
coinmarketbuzz.com leverages advanced AI technology to analyze market data. All content is fact-checked and reviewed by our editorial team to ensure accuracy and neutrality.