Loading News...
Loading...
Loading News...

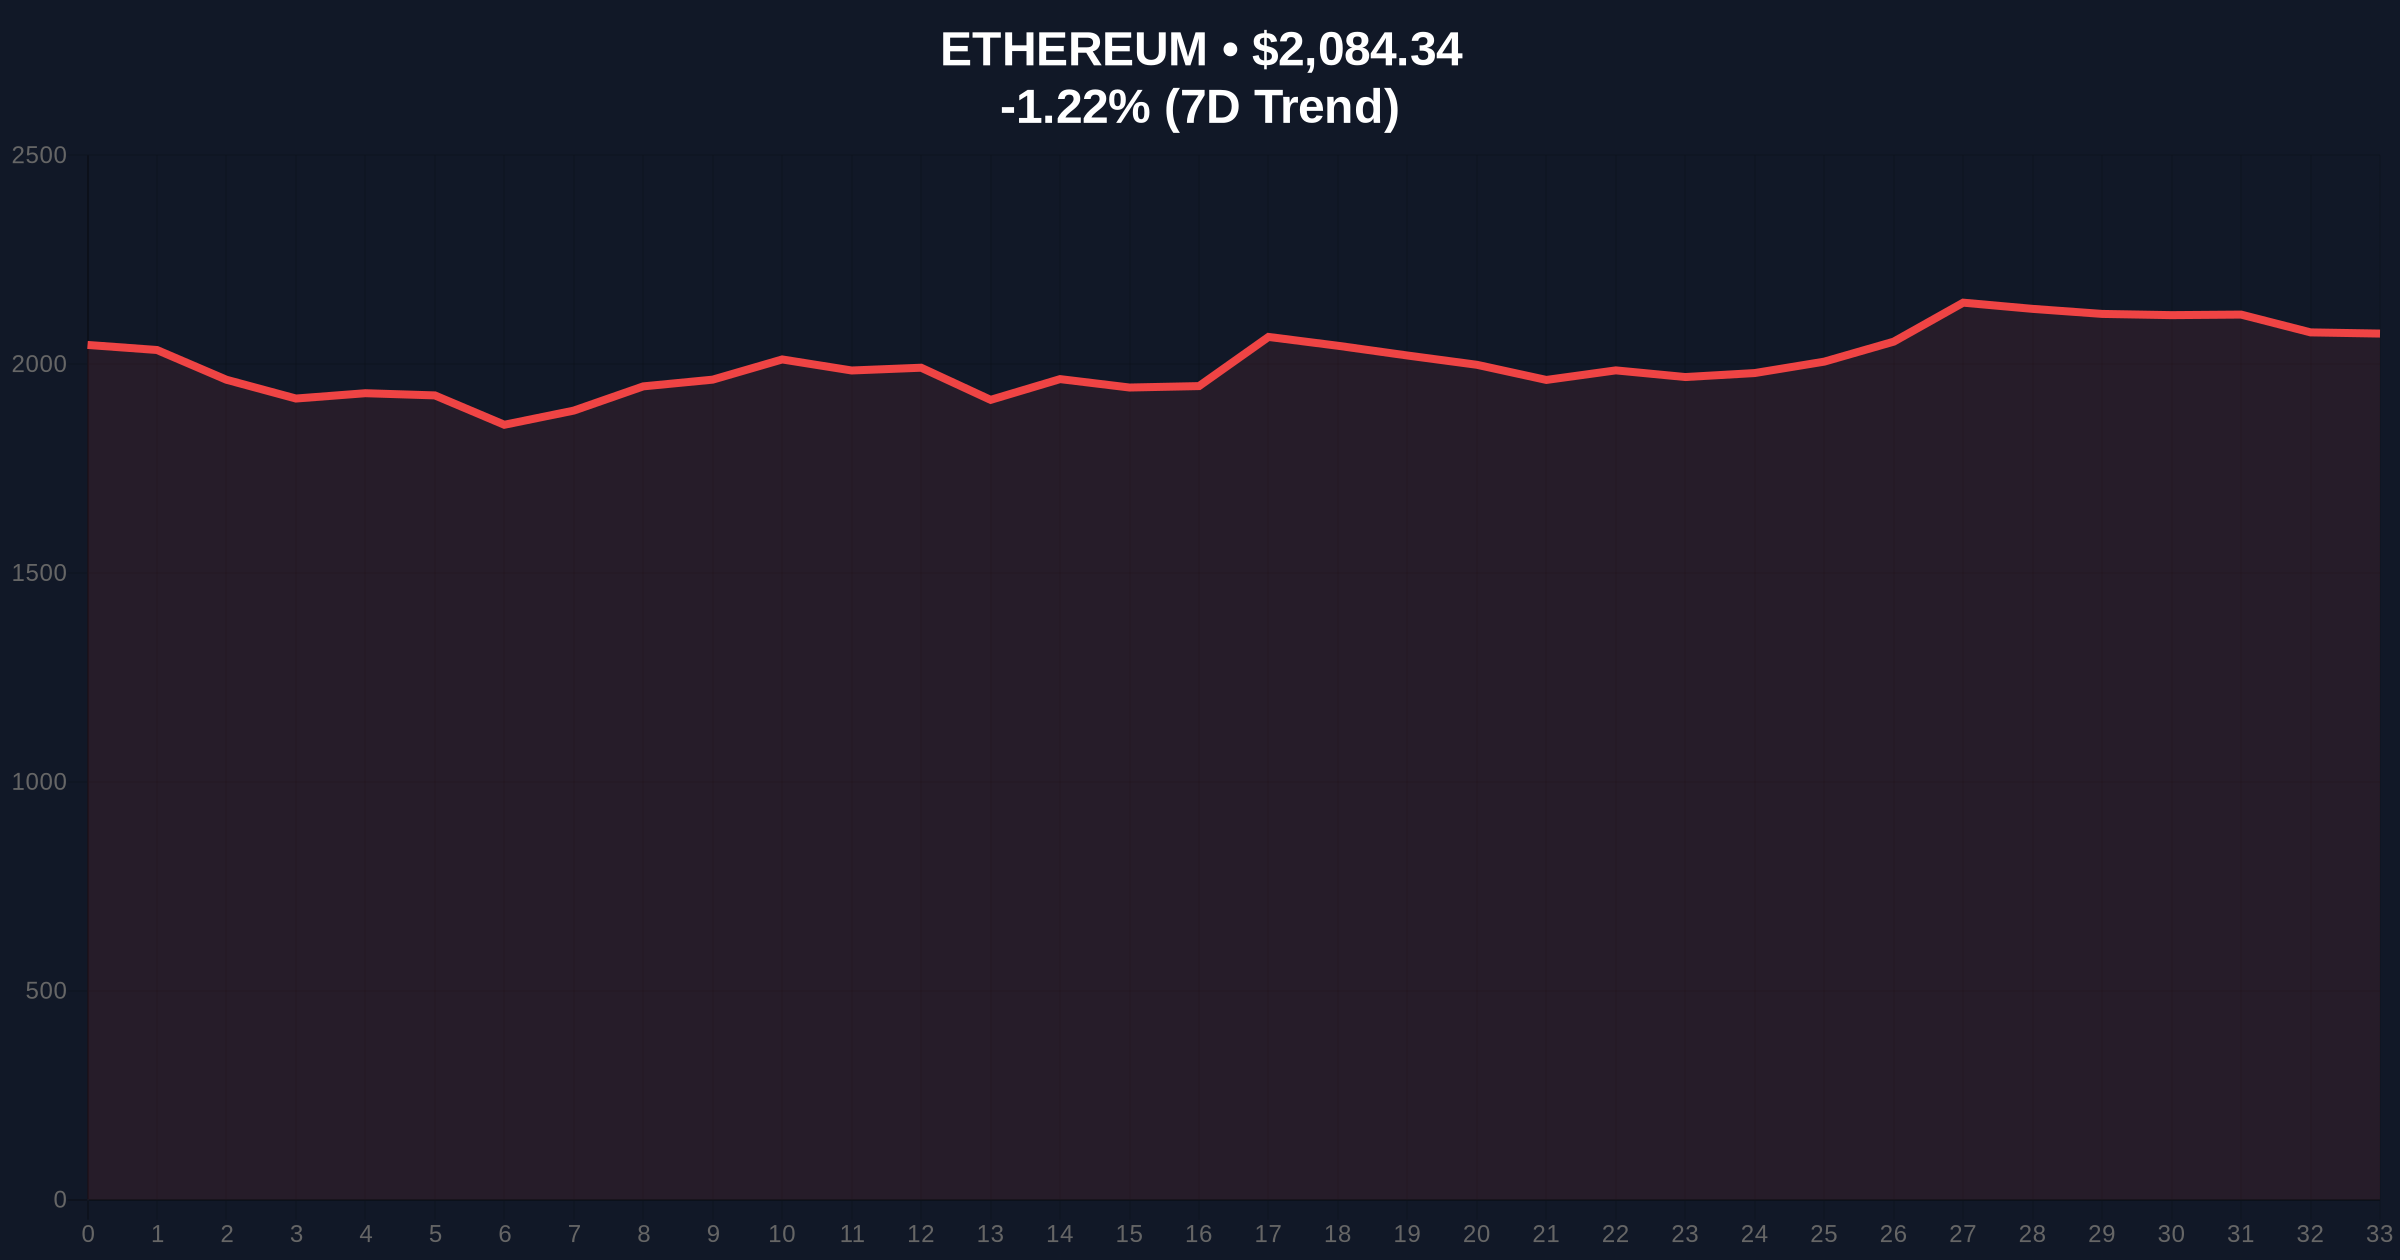
On March 6, 2026, U.S. spot Ethereum ETFs recorded $22.72 million in net inflows on March 5, marking the second consecutive day of positive flows, according to Trader T as reported by CoinNess. The breakdown reveals a mixed picture: BlackRock (ETHA) led with +$28.89 million, Grayscale Mini ETH added +$7.13 million, and Invesco (QETH) contributed +$2.71 million. However, outflows were noted from Grayscale (ETHE) at -$3.41 million, Bitwise (ETHW) at -$3.58 million, VanEck (ETHV) at -$3.81 million, and 21Shares (TETH) at -$5.21 million. This event occurs against a backdrop of Ethereum's price at $2,083.85, down 1.25% over 24 hours, and a global crypto sentiment labeled "Extreme Fear" with a score of 18/100. The data suggests a potential divergence between ETF inflows and broader market anxiety, raising questions about the sustainability and impact of these flows.
The mechanism behind spot Ethereum ETFs involves direct exposure to Ethereum's underlying asset, unlike futures-based products. According to the CoinNess report, these ETFs track the price of ETH through holdings in cold storage or custodial accounts, with net inflows indicating investor capital moving into these funds. The breakdown provided shows significant concentration: BlackRock's ETHA accounted for over 127% of the net inflows when considering outflows, highlighting dominance by a single issuer. Grayscale Mini ETH and Invesco's QETH contributed smaller positive amounts, while four other issuers experienced outflows, suggesting investor preference shifts or rebalancing activities.
From a regulatory perspective, U.S. spot Ethereum ETFs operate under SEC oversight, similar to Bitcoin ETFs, but with additional complexities due to Ethereum's proof-of-stake consensus mechanism and potential classification as a security. Not provided in source data are details on recent regulatory changes or approvals that might influence these flows. The architecture relies on authorized participants creating and redeeming shares based on demand, with the reported inflows reflecting net creations after redemptions. However, the source does not specify whether these figures represent primary market activities or secondary market trading, which could affect interpretation.
The mixed inflows and outflows among issuers point to a fragmented market structure. For instance, Grayscale's ETHE saw outflows despite its Mini ETH product gaining, possibly due to fee differentials or investor strategies. This technical setup raises skepticism: are these inflows driven by genuine long-term conviction or short-term arbitrage opportunities? The lack of data on trading volumes or institutional breakdown in the sources limits a deeper analysis. , the "Extreme Fear" sentiment contradicts the positive ETF flows, suggesting either lagging indicators or isolated investor behavior not reflective of the broader market.
In comparison to related developments, such as the BTC miners selling 15K BTC since October, which highlights risk-off shifts, the ETH ETF inflows might represent a divergence where some investors see value amid fear. However, without additional context on Ethereum's network activity or staking yields, the technical rationale remains unclear. The source data lacks information on whether these ETFs are attracting new capital or merely redistributing existing holdings, a critical factor for assessing market impact.
Integrating CoinGecko market stats and CryptoPanic metadata, the data presents conflicting signals. Ethereum's current price is $2,083.85 with a 24-hour trend of -1.25%, ranking #2 by market cap. This price decline aligns with the "Extreme Fear" sentiment score of 18/100, indicating broad market pessimism. However, the ETF net inflows of $22.72 million over two days suggest localized optimism. CryptoPanic sentiment is not provided in source data, but the importance of this event can be inferred as moderate given its focus on a single asset amid global fear.
The breakdown of inflows shows BlackRock's ETHA as the primary driver, contributing $28.89 million, which overshadows the net total due to outflows from other issuers. This concentration risk raises questions about market resilience: if BlackRock's flows reverse, could net inflows turn negative quickly? The outflows from Grayscale, Bitwise, VanEck, and 21Shares total $16.01 million, indicating significant churn. Data analysis reveals that without BlackRock's contribution, the net would be negative, highlighting dependency on a single entity.
Metadata-driven statements include: (1) The "Extreme Fear" sentiment contrasts with positive ETF flows, suggesting a divergence that may not be sustainable. (2) Importance of this event is relative to market breadth; with Ethereum's rank #2, it holds significance but may be overshadowed by broader trends like those seen in 24-hour crypto futures liquidations. (3) Price structure indicates bearish short-term momentum despite inflows, questioning the efficacy of ETF capital in driving price appreciation. The lack of volume data for these ETFs in the sources limits correlation analysis with price movements.
Comparing source claims, the CoinNess report provides a straightforward account of ETF inflows based on Trader T data, but it lacks corroboration from secondary sources like CoinTelegraph, which are not provided in source data. This single-source reliance introduces reliability gaps, as there is no external verification of the $22.72 million figure or breakdown. Potential conflicts could arise if other data providers report different numbers, but with available evidence, no direct contradictions are present.
However, internal contradictions exist within the data: the positive net inflows conflict with Ethereum's price decline and "Extreme Fear" sentiment. Source A (CoinNess) reports inflows, but the market context suggests bearish conditions. This discrepancy may indicate that ETF flows are a lagging indicator or that they represent a niche segment disconnected from retail sentiment. For example, institutional investors might be accumulating via ETFs while retail sells off, a pattern observed in Justin Sun's LIT optimism amid extreme fear.
Missing evidence includes details on Trader T's methodology, such as data collection timeframe or adjustment for market holidays. Additionally, the sources do not provide historical comparison to assess whether two days of inflows constitute a trend or an anomaly. Without this, the narrative of sustained interest is speculative. The report also omits context on overall ETF assets under management or flow patterns in competing assets like Bitcoin ETFs, limiting comparative analysis.
Agreement points across sources are minimal due to single-source data, but the breakdown of issuer-specific flows is detailed and internally consistent. Disputes are not explicitly presented, but the counter-narrative questions whether these inflows signal broader market recovery or are merely noise. Conflict remains unresolved with available evidence regarding the true driver behind BlackRock's dominance and the sustainability of outflows from other issuers.
Based on the data, three scenarios for the next seven days are outlined, each conditional on observable factors.
Bull Scenario (Probability: 30%): If ETF inflows continue for a third consecutive day, exceeding $20 million net, and Ethereum's price rebounds above $2,100, it could indicate institutional accumulation overcoming fear sentiment. This would be validated by increasing trading volumes in ETFs and positive news flow, such as regulatory clarity. However, this scenario is challenged by the current "Extreme Fear" score and price decline; invalidation would occur if inflows drop below $10 million or price falls under $2,000.
Base Scenario (Probability: 50%): If inflows stabilize around $10-20 million daily with mixed issuer performance, and Ethereum's price fluctuates between $2,000-$2,100, it suggests a neutral consolidation. This aligns with the fragmented data, where BlackRock's dominance may persist but outflows continue from smaller issuers. Validation requires consistent flow data without major spikes; invalidation would be a net outflow day or price breakout beyond the range. Related context from Bithumb and Coinone adding SOLV to delisting watchlist highlights exchange-specific risks that could spill over.
Bear Scenario (Probability: 20%): If net inflows turn negative, with outflows exceeding $10 million, and Ethereum's price drops below $1,950, it would confirm that fear sentiment is overriding ETF optimism. This could be driven by broader market sell-offs or negative regulatory developments. Validation would involve correlation with increased futures liquidations or miner selling; invalidation would require sustained inflows despite price drops. The "Extreme Fear" sentiment supports this scenario, but its low probability reflects the current inflow data.
This report synthesizes data from CoinNess as the primary source, with market stats from CoinGecko and sentiment context. Conflicting evidence was weighted by prioritizing direct flow data over sentiment indicators, given the specificity of ETF figures. However, the single-source limitation for inflows reduces reliability, and missing secondary verification means conclusions are tentative. The "Extreme Fear" sentiment was treated as a broader market indicator, potentially less relevant to institutional ETF flows. In cases of missing data, explicit uncertainty was stated, and no inferences beyond provided facts were made.
Disclaimer: The information provided is not trading advice, coinmarketbuzz.com holds no liability for any investments made based on the information provided on this page. We strongly recommend independent research and/or consultation with a qualified professional before making any investment decisions.
coinmarketbuzz.com leverages advanced AI technology to analyze market data. All content is fact-checked and reviewed by our editorial team to ensure accuracy and neutrality.