Loading News...
Loading...
Loading News...

VADODARA, February 5, 2026 — U.S. spot Ethereum ETFs recorded a sharp $78.11 million net outflow on February 4. This daily crypto analysis reveals a swift reversal after just one day of inflows. According to TraderT data, no individual fund registered net inflows. BlackRock's iShares Ethereum Trust (ETHA) led the exodus with -$57.58 million. Fidelity's Fidelity Ethereum Fund (FETH) followed with -$20.53 million.
Data from TraderT confirms the outflow event. The reversal occurred immediately after a brief inflow period. This pattern suggests a classic liquidity grab. Large holders are exiting ETF wrappers to seek cash or redeploy capital. The concentrated selling from top-tier issuers like BlackRock and Fidelity amplifies the signal. Market structure indicates coordinated risk-off behavior.
Historically, ETF flow reversals precede volatile price discovery phases. The current extreme fear sentiment, scoring 12/100, mirrors conditions seen in late 2022. In contrast, the 2024-2025 bull run sustained consistent ETF inflows. Underlying this trend is a macro shift towards risk aversion. This outflow event coincides with broader market stress. For instance, Bitcoin ETFs have also faced significant redemptions recently. , derivatives markets reflect similar pessimism, as seen in bearish futures skew and long/short ratios.
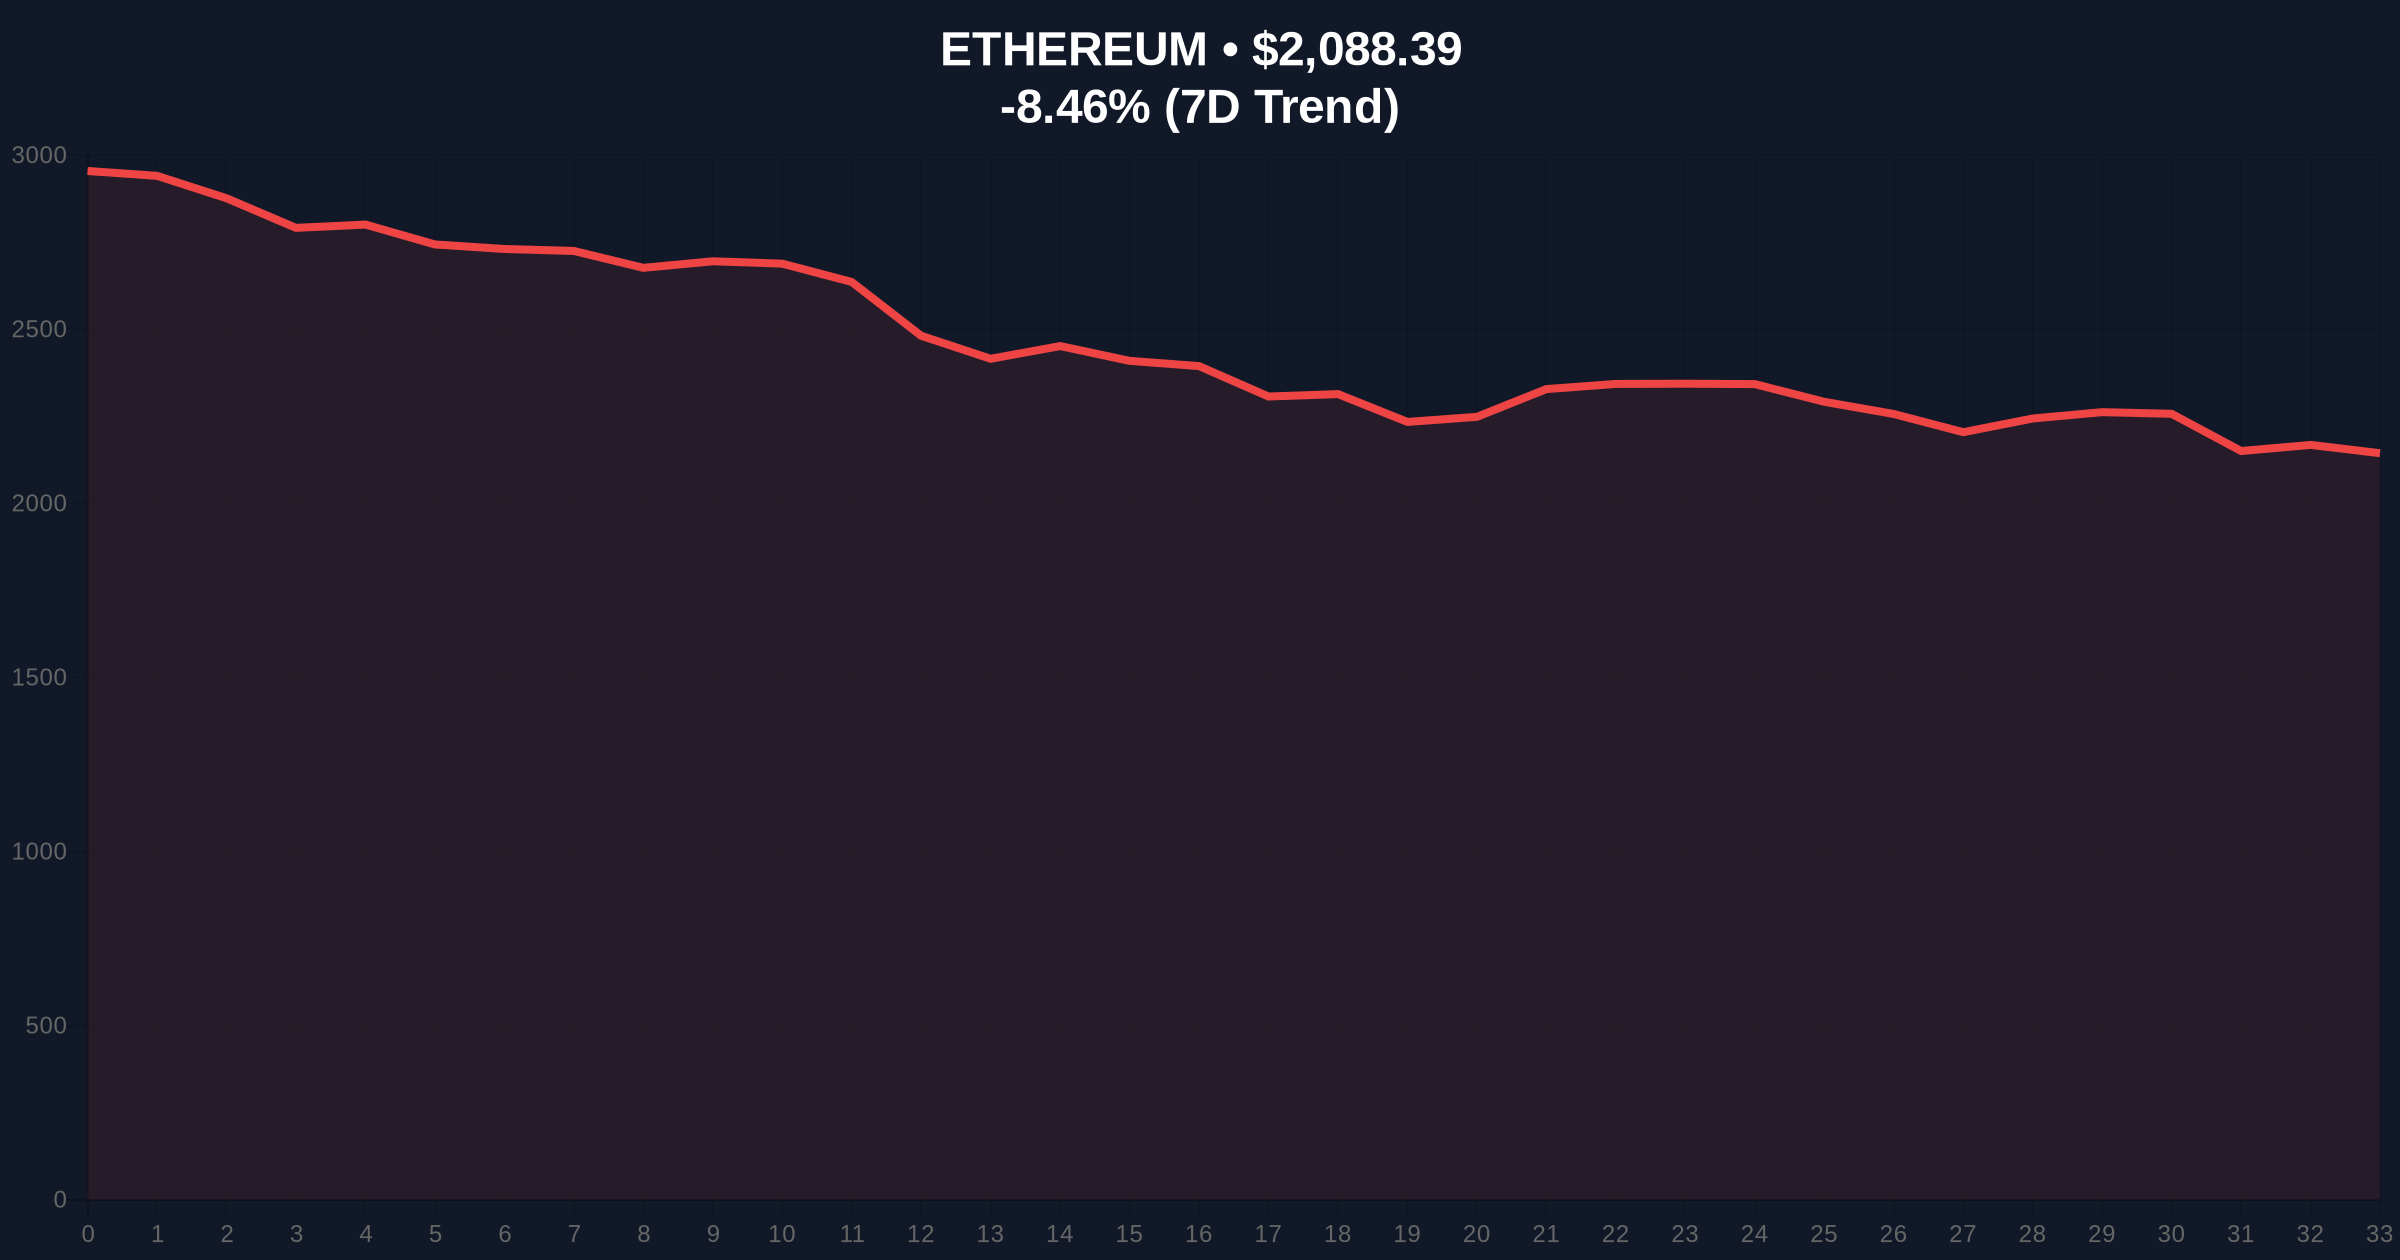
Ethereum price action shows critical technical damage. The asset trades at $2,087.12, down 8.51% in 24 hours. A major Fair Value Gap (FVG) exists between $2,150 and $2,200. The 200-day moving average at $2,050 provides nominal support. However, the Volume Profile Point of Control (VPOC) sits lower near $1,950. The Relative Strength Index (RSI) on the daily chart prints at 28, signaling oversold conditions. A Fibonacci retracement from the 2025 all-time high shows the 0.618 level at $1,920. This confluence creates a high-probability Order Block for institutional buyers.
| Metric | Value |
|---|---|
| Net ETF Outflow (Feb 4) | $78.11M |
| BlackRock ETHA Outflow | -$57.58M |
| Fidelity FETH Outflow | -$20.53M |
| Crypto Fear & Greed Index | Extreme Fear (12/100) |
| Ethereum Current Price | $2,087.12 |
| 24-Hour Price Change | -8.51% |
This matters for portfolio liquidity and market structure. Spot ETF flows represent institutional capital allocation decisions. A net outflow removes direct buying pressure from the underlying asset. Consequently, it exacerbates selling pressure on Ethereum's order books. The shift impacts Ethereum's post-merge issuance economics. Staking yields may face downward pressure if liquid staking token (LST) demand wanes. Retail sentiment often follows institutional lead with a lag. This creates a negative feedback loop for prices.
The $78 million outflow is a clear risk-off signal. It invalidates the brief inflow narrative from the prior day. Market participants are re-evaluating exposure amid macro uncertainty and regulatory overhang. The key watch is whether this triggers a cascade in Grayscale's ETHE or other wrapped products.
— CoinMarketBuzz Intelligence Desk
Two primary technical scenarios emerge from current market structure.
The 12-month institutional outlook hinges on macroeconomic policy and Ethereum's Pectra upgrade timeline. If the Federal Reserve signals dovish pivot, capital may return to risk assets. However, continued outflows could prolong the consolidation phase. The 5-year horizon remains tied to Ethereum's scaling roadmap and institutional adoption of its official blockchain infrastructure.

Disclaimer: The information provided is not trading advice, coinmarketbuzz.com holds no liability for any investments made based on the information provided on this page. We strongly recommend independent research and/or consultation with a qualified professional before making any investment decisions.
coinmarketbuzz.com leverages advanced AI technology to analyze market data. All content is fact-checked and reviewed by our editorial team to ensure accuracy and neutrality.