Loading News...
Loading...
Loading News...

VADODARA, January 16, 2026 — U.S. spot Ethereum ETFs recorded a net inflow of $164.32 million on January 15, marking the fourth consecutive day of positive flows, according to data from TraderT. This daily crypto analysis examines the underlying market mechanics and institutional positioning driving this sustained accumulation pattern. No individual fund experienced a net outflow during this period, with BlackRock's ETHA leading inflows at $149.11 million and Grayscale's Mini ETH following with $15.21 million.
This sustained inflow pattern emerges against a backdrop of neutral global crypto sentiment and follows months of regulatory clarity around Ethereum's classification. According to the official SEC filing that approved these products, Ethereum's transition to proof-of-stake consensus created a distinct regulatory framework that differs from Bitcoin's treatment. The current accumulation phase mirrors institutional behavior observed during Bitcoin ETF launches in early 2024, where consistent inflows preceded significant price appreciation cycles. Market structure suggests this represents a strategic positioning rather than speculative trading, as evidenced by the absence of daily outflows across all funds.
According to TraderT's flow data, U.S. spot Ethereum ETFs have recorded positive net inflows for four consecutive trading days, culminating in the January 15 figure of $164.32 million. BlackRock's ETHA captured approximately 91% of the total inflow, indicating concentrated institutional preference for established asset managers. Grayscale's Mini ETH product absorbed the remaining $15.21 million, while other providers maintained neutral flows. This pattern represents the longest sustained inflow streak since these products launched in late 2025, suggesting a shift from initial distribution phases to accumulation phases in the product lifecycle.
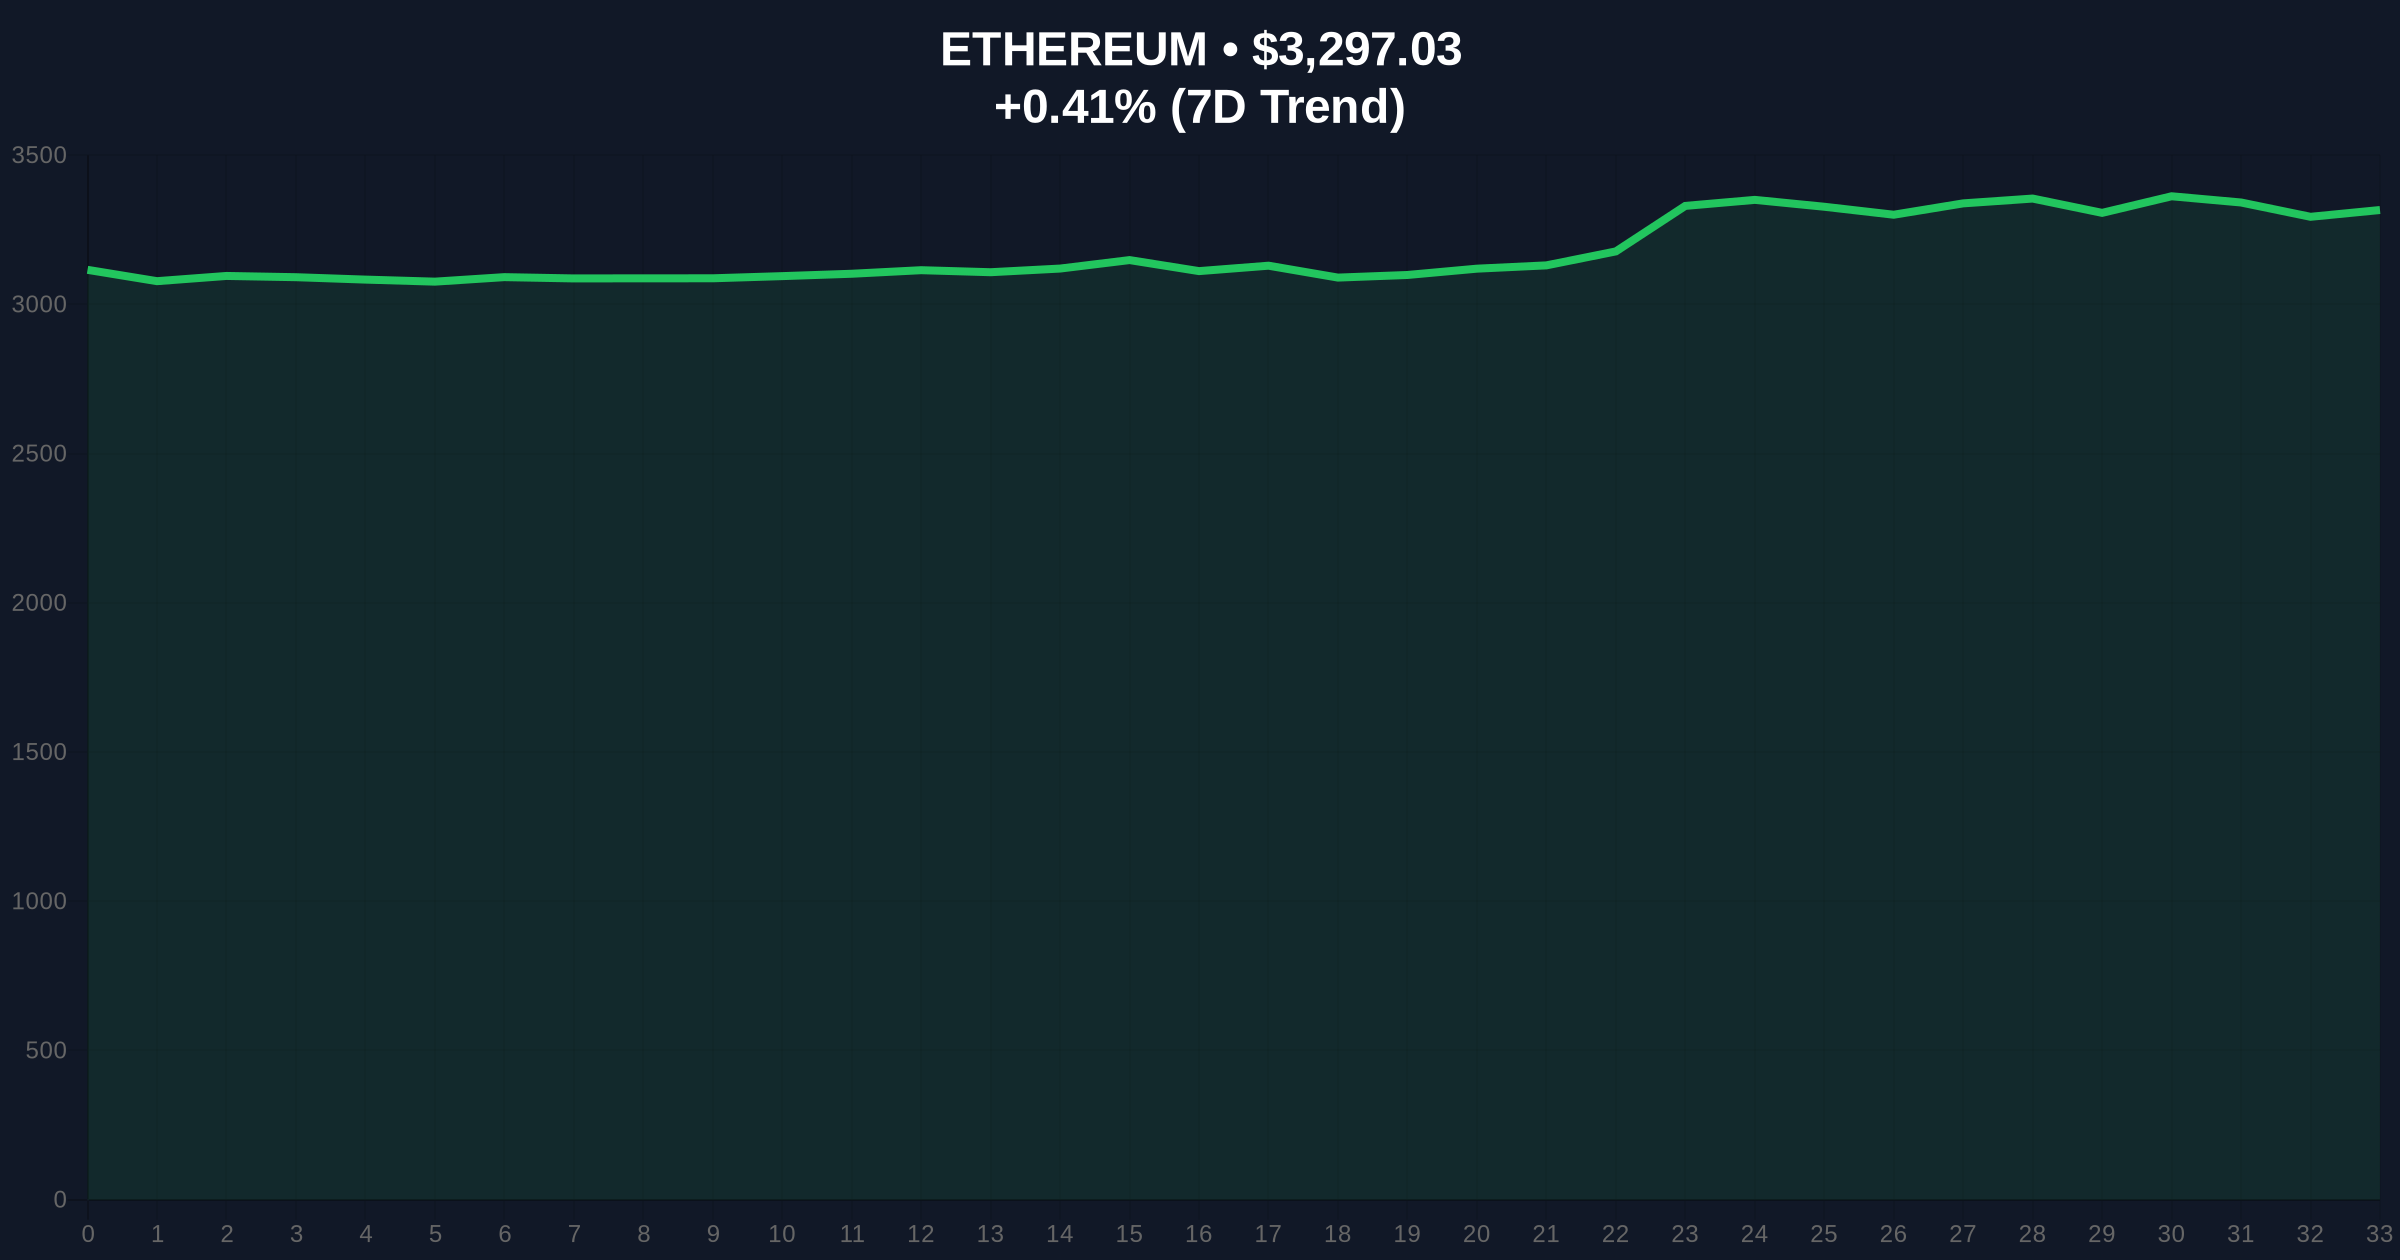
Ethereum currently trades at $3,297.63, representing a 0.43% increase over the past 24 hours. Volume profile analysis indicates significant accumulation between $3,150 and $3,350, creating a high-volume node that serves as immediate support. The Relative Strength Index (RSI) sits at 52, indicating neutral momentum without overbought or oversold conditions. The 50-day moving average at $3,280 provides dynamic support, while resistance converges at the $3,450 level where previous liquidation events occurred. A Fair Value Gap (FVG) exists between $3,100 and $3,200 from January's volatility, which market makers may target for liquidity grabs.
| Metric | Value |
|---|---|
| Daily ETF Net Inflow (Jan 15) | $164.32M |
| Consecutive Inflow Days | 4 |
| BlackRock ETHA Inflow | $149.11M |
| Current ETH Price | $3,297.63 |
| 24-Hour Price Change | +0.43% |
| Crypto Fear & Greed Index | 49/100 (Neutral) |
| Market Rank | #2 |
For institutional portfolios, sustained ETF inflows represent a structural demand source that reduces circulating supply through direct custodial holdings. According to Ethereum.org documentation, the network's post-merge issuance rate of approximately 0.5% annually means consistent ETF buying pressure could outpace new supply creation. For retail traders, this creates a divergence between spot market accumulation and derivatives positioning, potentially setting up a gamma squeeze scenario if options market makers become under-hedged. The concentration in BlackRock's product suggests institutional preference for scale and liquidity, which could further centralize Ethereum's custodial .
Market analysts on X/Twitter highlight the divergence between neutral sentiment indicators and strong fundamental inflows. One quantitative researcher noted, "The four-day inflow streak represents approximately 0.25% of Ethereum's circulating supply being removed from tradable markets—a significant structural shift." Another observer pointed to parallels with Bitcoin's institutional accumulation phases that preceded major rallies. Bears counter that recent futures liquidations exceeding $145 million indicate leveraged positioning remains vulnerable despite spot accumulation.
Bullish Case: If ETF inflows continue at current rates, they could absorb approximately 1.5% of circulating supply monthly. Combined with Ethereum's upcoming Pectra upgrade (EIP-7702) enhancing account abstraction, this could drive ETH toward the $3,800 resistance level by Q2 2026. The Bullish Invalidation level sits at $3,150—a break below would indicate institutional demand has weakened.
Bearish Case: Should global risk assets deteriorate or regulatory concerns resurface, ETF flows could reverse rapidly. A breakdown below the $3,150 support would target the Fair Value Gap at $3,100, potentially triggering stop-loss cascades. The Bearish Invalidation level is $3,450—a sustained break above would confirm accumulation has overcome overhead supply.
Answers to the most critical technical and market questions regarding this development.

Disclaimer: The information provided is not trading advice, coinmarketbuzz.com holds no liability for any investments made based on the information provided on this page. We strongly recommend independent research and/or consultation with a qualified professional before making any investment decisions.
coinmarketbuzz.com leverages advanced AI technology to analyze market data. All content is fact-checked and reviewed by our editorial team to ensure accuracy and neutrality.