Loading News...
Loading...
Loading News...

VADODARA, January 15, 2026 — Ethereum's market structure suggests an imminent liquidity grab targeting over-leveraged long positions, potentially clearing the path for a rally toward $4,100. This daily crypto analysis examines the technical and on-chain data indicating a classic market reset scenario.
Market structure suggests this potential correction mirrors the 2021 pattern where Ethereum experienced multiple liquidity sweeps before major rallies. According to Glassnode liquidity maps, similar leverage ratios of 0.60 have historically preceded brief declines of 15-20% to reset derivative markets. The current environment parallels the Q4 2023 correction where ETH cleared $500 million in long liquidations before advancing 85% over the following quarter. Historical cycles indicate that such liquidity grabs often create optimal entry points for institutional accumulation.
Related developments in the broader market include the ongoing regulatory discussions around market structure and the structural shifts in traditional finance toward tokenization that could impact Ethereum's long-term utility.
According to Cointelegraph's report citing multiple experts, Ethereum's current leverage ratio of 0.60 has historically preceded brief declines. Crypto analyst Pelin Ay noted this pattern typically involves a drop to clear over-leveraged long positions before a strong rebound. Glassnode analyst Sean Rose observed that ETH's Spent Output Profit Ratio (SOPR) remains below one, indicating realized losses still exceed profits. Hyblock data shows $500 million in long position liquidations clustered around the $3,100 price point, creating a significant liquidity pool that market makers may target.
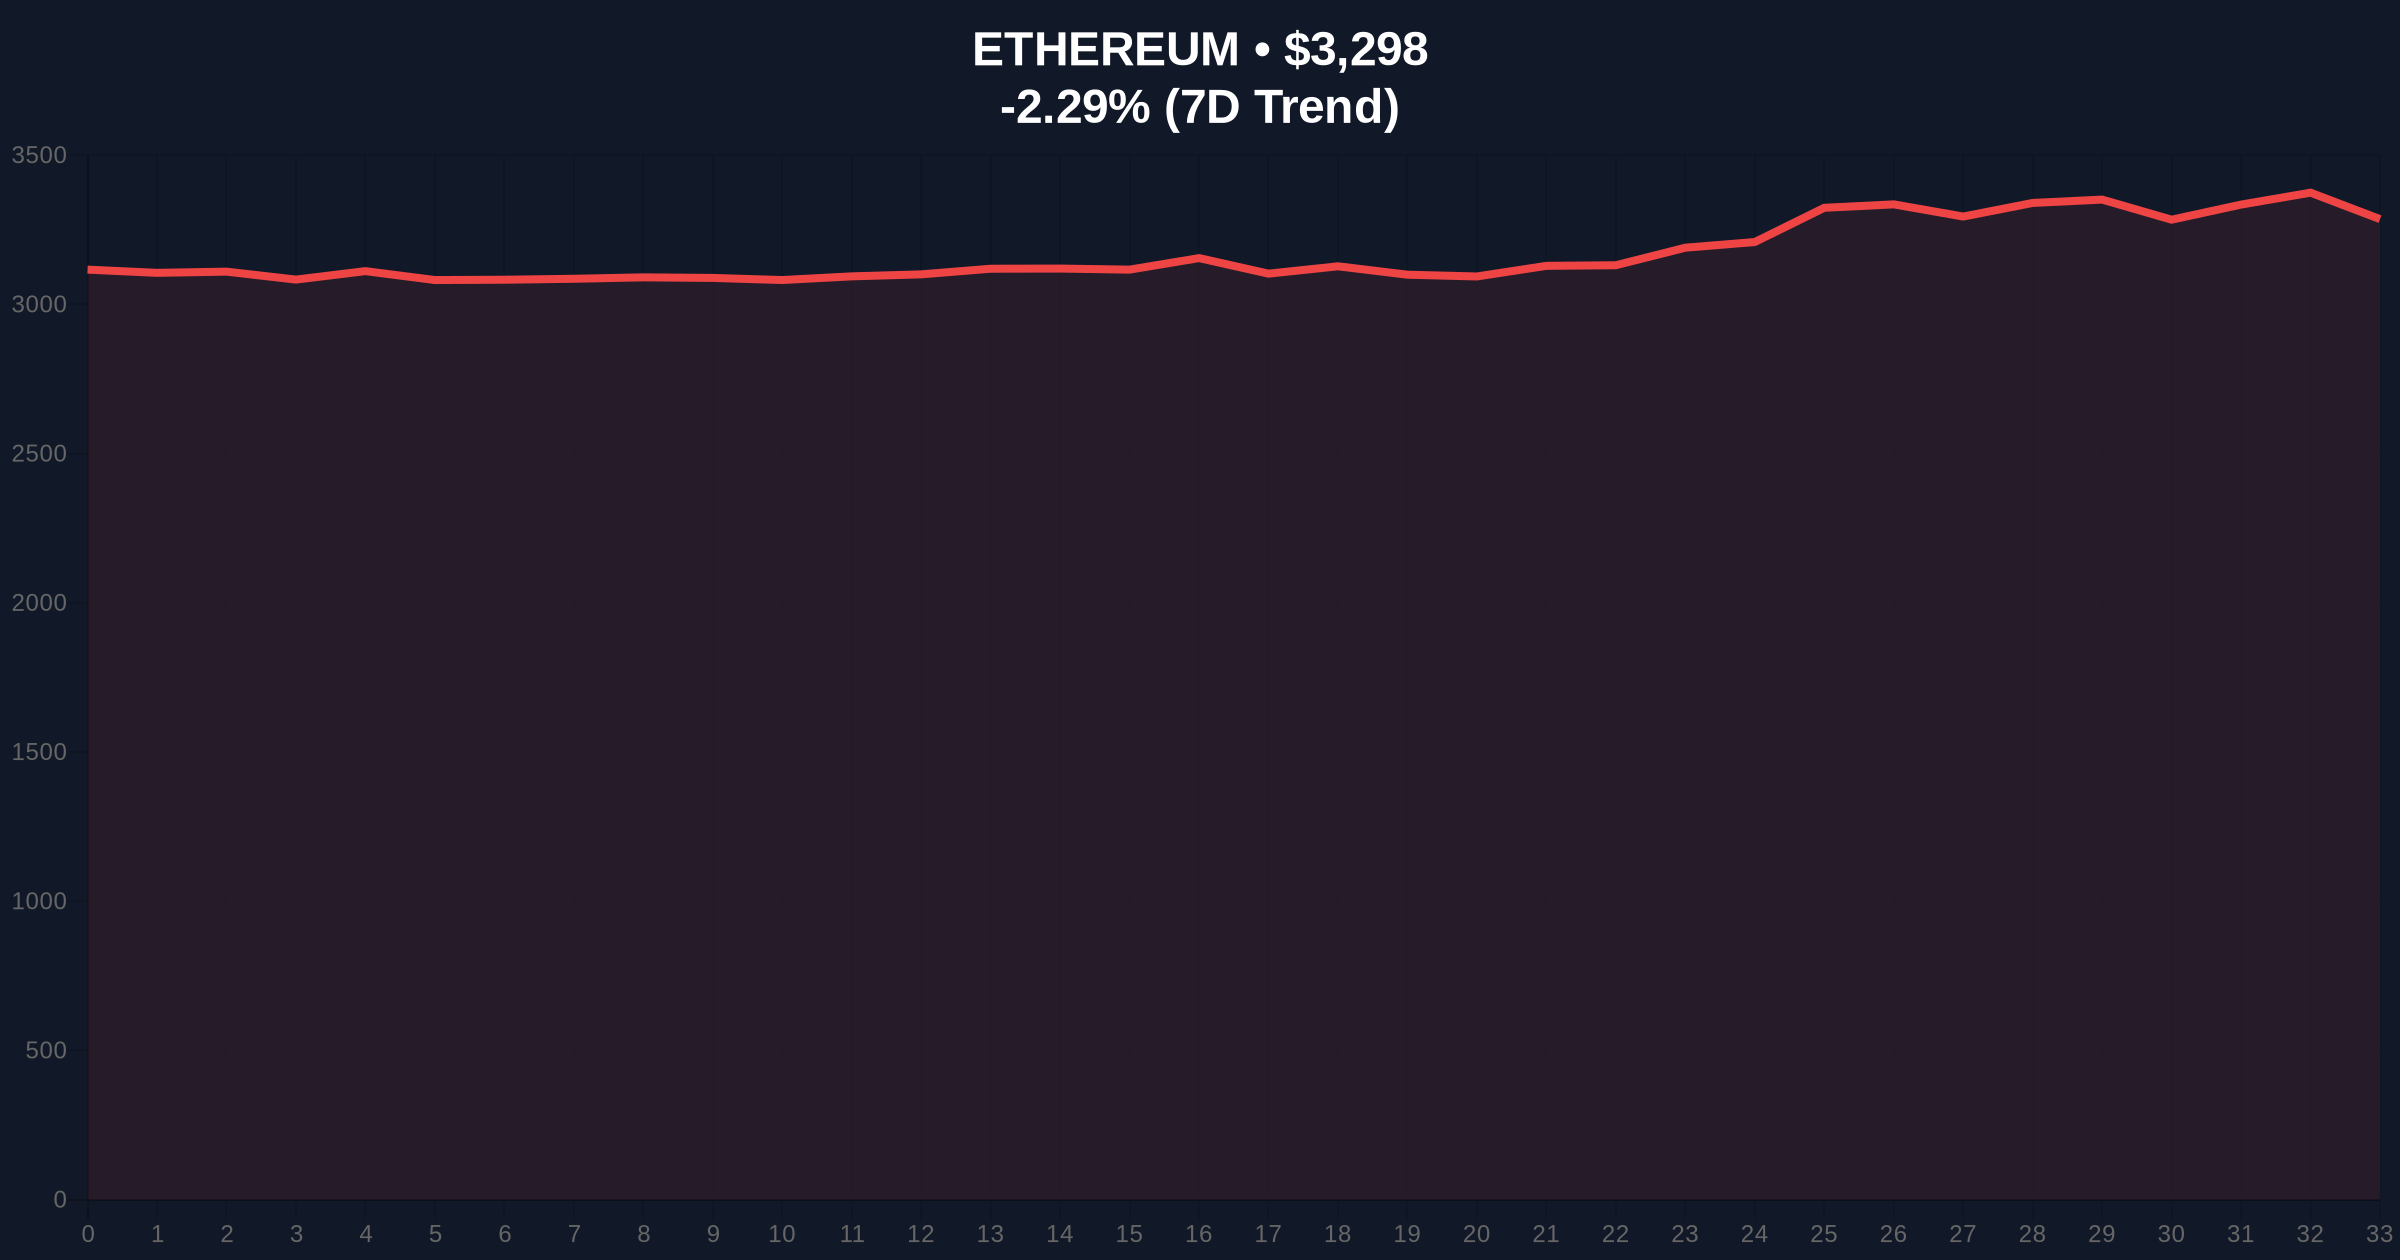
Market structure suggests Ethereum is testing a critical order block between $3,250 and $3,350. The 24-hour trend of -2.31% to $3,297.43 indicates initial selling pressure. The Relative Strength Index (RSI) on the daily timeframe is approaching overbought territory at 68, while the 50-day moving average provides dynamic support at $3,150. A Fair Value Gap (FVG) exists between $3,050 and $3,180 from the January 10 rally, which may act as a magnet for price action.
Bullish Invalidation Level: A sustained break below $3,000 would invalidate the rally thesis, suggesting deeper correction toward the 200-day moving average at $2,850.
Bearish Invalidation Level: A decisive close above $3,450 would negate the short-term dip scenario, indicating immediate continuation toward $3,800 resistance.
| Metric | Value | Significance |
|---|---|---|
| Current Price | $3,297.43 | Testing key order block resistance |
| 24h Change | -2.31% | Initial selling pressure emerging |
| Crypto Fear & Greed Index | 61 (Greed) | Overheated sentiment typical before corrections |
| Market Rank | #2 | Maintains dominance position |
| Leverage Ratio | 0.60 | Historically precedes liquidity grabs |
| Liquidation Cluster | $500M at $3,100 | Primary target for market makers |
For institutional investors, a successful liquidity grab at $3,100 would create an optimal accumulation zone with defined risk parameters. Retail traders face potential liquidation of over-leveraged positions, highlighting the importance of proper position sizing. The broader implication involves Ethereum's post-merge issuance schedule and how derivative market resets impact staking economics. According to Ethereum's official documentation on proof-of-stake mechanics, network security remains robust regardless of short-term price volatility.
Market analysts on X/Twitter are divided between those anticipating the dip as a buying opportunity and others warning of extended correction. The dominant narrative suggests "this is healthy for the market" to reset excessive leverage. No specific quotes from industry leaders were provided in the source material, but general sentiment aligns with historical patterns where liquidity sweeps precede sustained rallies.
Bullish Case: If Ethereum successfully executes a liquidity grab at $3,100 and holds above $3,000, market structure suggests a rally toward $4,100 becomes probable. This would represent a 32% gain from the dip low and would likely involve clearing the $3,800 resistance zone that has capped previous advances.
Bearish Case: Failure to hold $3,000 support could trigger a deeper correction toward $2,850 (200-day MA) or even $2,600 (0.618 Fibonacci retracement of the November-January rally). This scenario would indicate broader market weakness and potentially delay the $4,100 target by several months.
Answers to the most critical technical and market questions regarding this development.

Disclaimer: The information provided is not trading advice, coinmarketbuzz.com holds no liability for any investments made based on the information provided on this page. We strongly recommend independent research and/or consultation with a qualified professional before making any investment decisions.
coinmarketbuzz.com leverages advanced AI technology to analyze market data. All content is fact-checked and reviewed by our editorial team to ensure accuracy and neutrality.