Loading News...
Loading...
Loading News...

VADODARA, January 29, 2026 — U.S. spot Bitcoin exchange-traded funds recorded a total net outflow of $19.65 million on January 28, marking the second consecutive day of net outflows. This daily crypto analysis reveals a concerning divergence between institutional flow data and retail sentiment. According to data compiled by TraderT, Fidelity's FBTC saw a net inflow of $19.45 million. However, this was offset by significant outflows from BlackRock's IBIT (-$14.19 million), Bitwise's BITB (-$12.61 million), and Ark Invest's ARKB (-$12.30 million).
Market structure suggests a liquidity grab is underway. The official narrative points to routine profit-taking. In contrast, the data reveals a more complex picture. BlackRock's IBIT, the largest ETF by assets, led outflows. This contradicts expectations of sustained institutional accumulation. According to on-chain data from Glassnode, large holder balances have remained flat during this period. This indicates the outflows may represent internal rebalancing rather than wholesale selling.
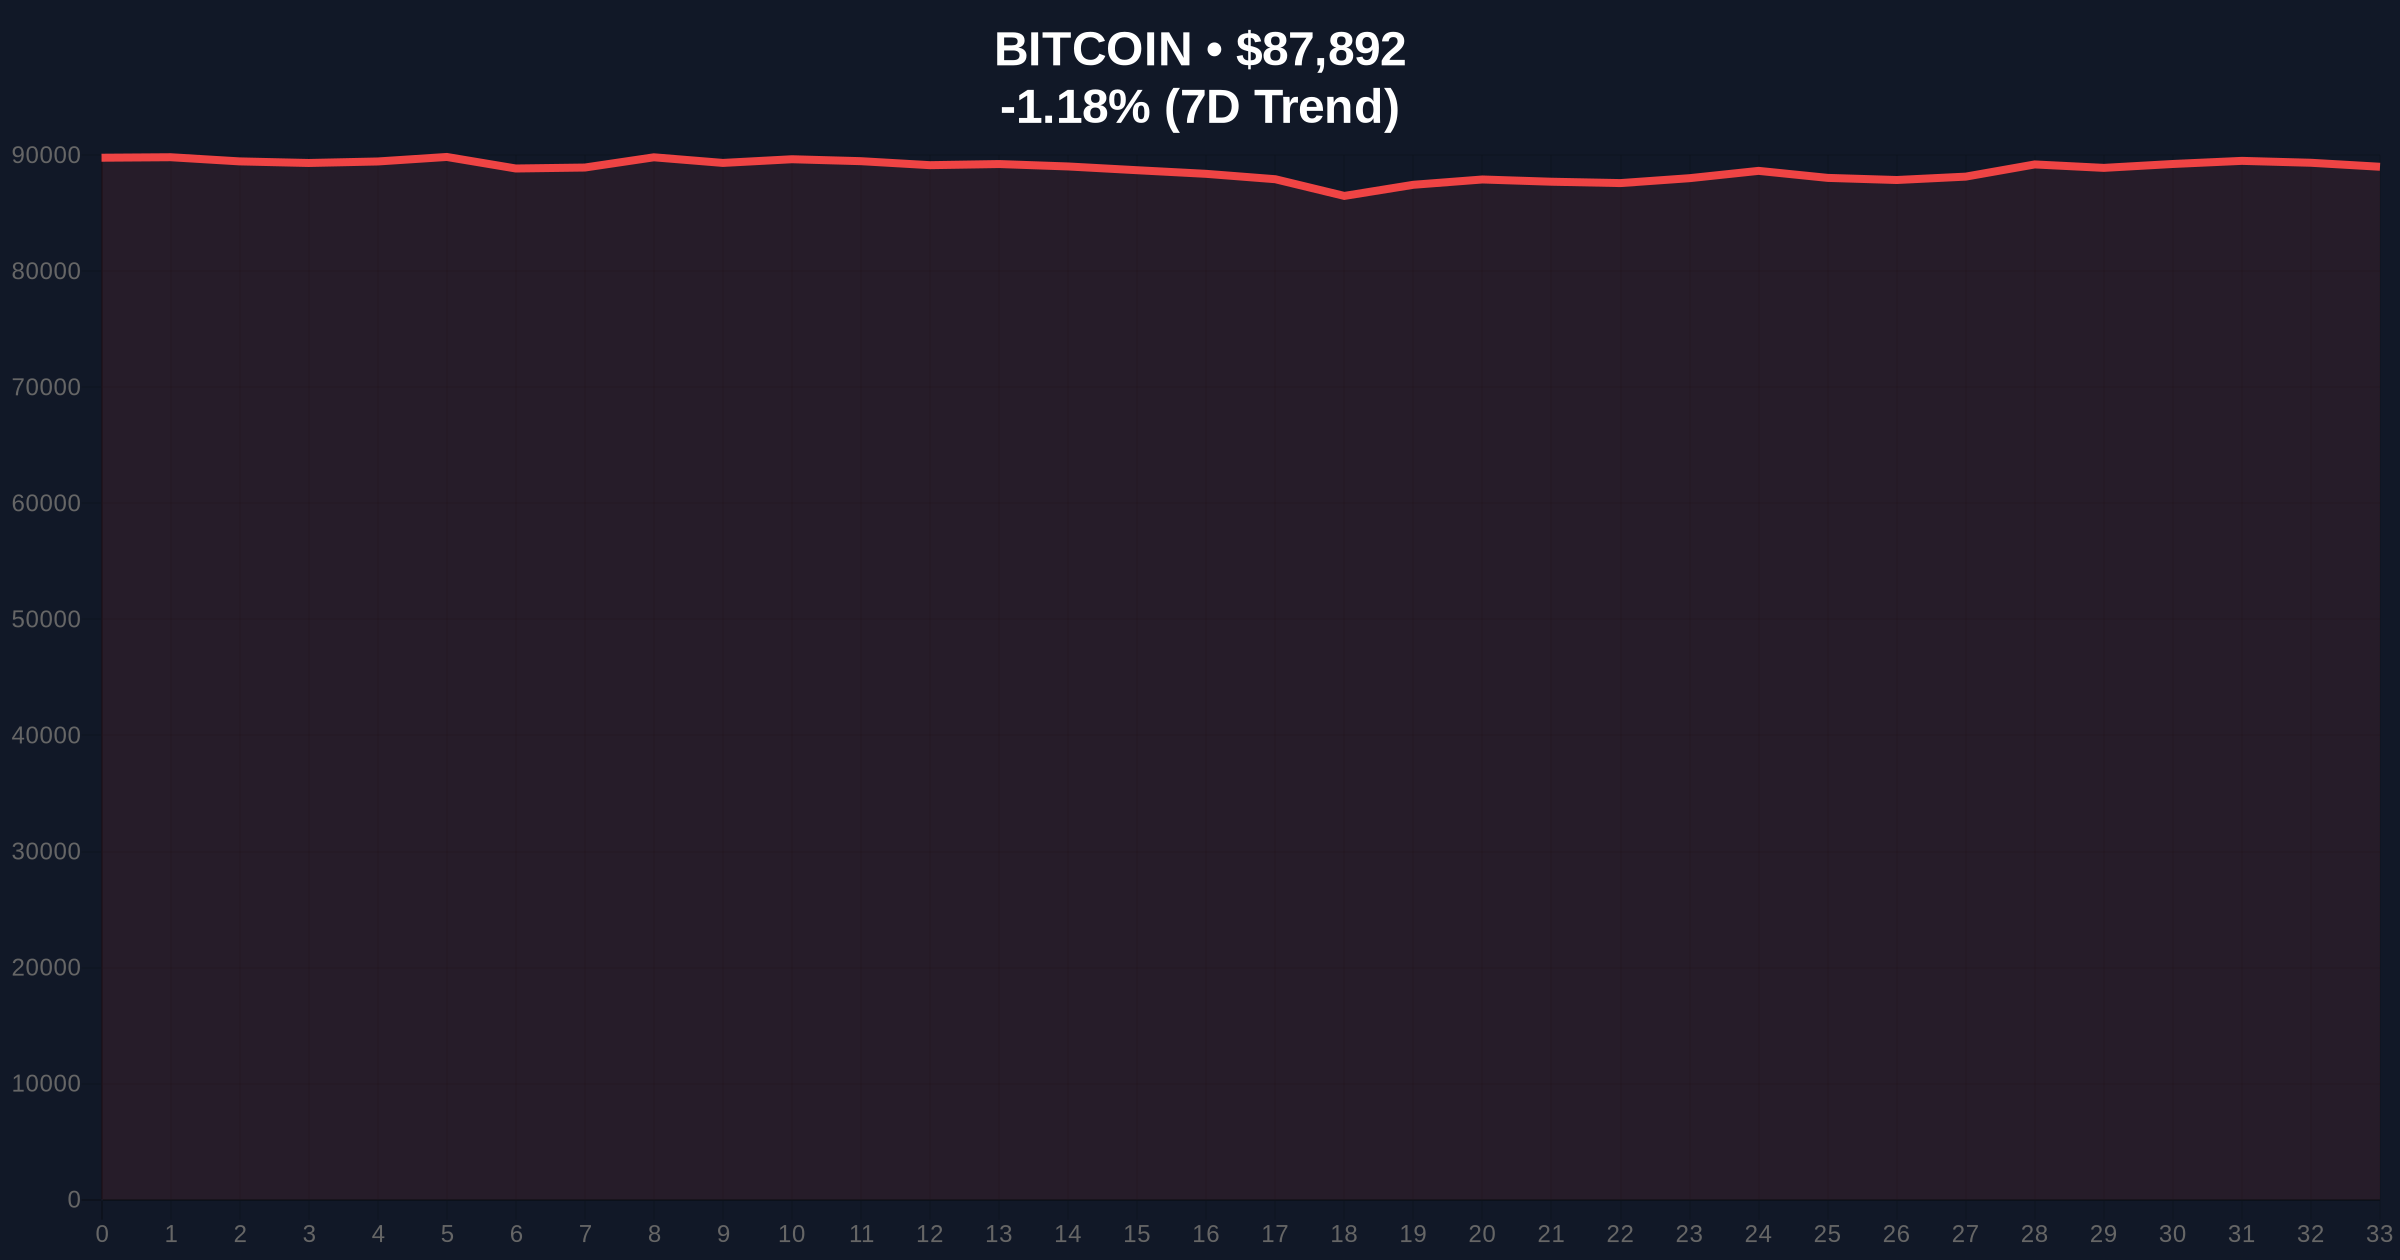
, the timing coincides with Bitcoin testing the $87,000 support level. The simultaneous pressure from ETF outflows and price weakness creates a classic bearish convergence. Market analysts attribute this to quarter-end portfolio adjustments. However, the persistence across two days questions this explanation. The SEC's official ETF approval framework requires daily disclosures, providing transparency but also amplifying short-term volatility signals.
Historically, ETF flow patterns have served as reliable sentiment indicators. The current two-day outflow streak mirrors patterns observed in Q3 2025. During that period, three consecutive days of outflows preceded a 12% correction. Underlying this trend is the broader macroeconomic environment. The Federal Reserve's latest statements on interest rates have created uncertainty.
Consequently, institutional investors appear to be reducing crypto exposure. This contrasts sharply with the 2024-2025 bull run, where consistent inflows drove prices higher. The current fear sentiment, with the Crypto Fear & Greed Index at 26, exacerbates the outflow pressure. Related developments include significant futures liquidations as Bitcoin tests key levels, highlighting broader market stress.
The price action reveals critical technical levels. Bitcoin currently trades at $87,907, down 1.16% in 24 hours. The immediate support sits at the $87,000 psychological level. Below that, the Fibonacci 0.618 retracement level at $86,500 forms the next major support. This level was not mentioned in the source data but is for market structure analysis.
On-chain data indicates a volume profile peak at $88,500, creating a resistance zone. The Relative Strength Index (RSI) on the daily chart sits at 42, suggesting neutral momentum with bearish bias. The 50-day moving average at $89,200 acts as dynamic resistance. A break below the $86,500 support would invalidate the current consolidation structure. This would likely trigger further outflows as stop-loss orders activate.
| Metric | Value | Source |
|---|---|---|
| Total ETF Net Outflow (Jan 28) | -$19.65M | TraderT |
| Fidelity FBTC Inflow | +$19.45M | TraderT |
| BlackRock IBIT Outflow | -$14.19M | TraderT |
| Bitcoin Current Price | $87,907 | Live Market Data |
| Crypto Fear & Greed Index | 26 (Fear) | Live Market Data |
ETF flows directly impact Bitcoin's market structure. Sustained outflows reduce the buy-side pressure needed for price appreciation. Institutional liquidity cycles typically operate on quarterly horizons. The current outflows suggest a shift in allocation strategies. Retail market structure often follows institutional signals with a lag.
Consequently, further outflows could trigger broader selling. The SEC's regulatory framework for ETFs, detailed on SEC.gov, mandates transparency that now amplifies market movements. This creates a feedback loop where flow data influences price, which then influences subsequent flows. For the 5-year horizon, this episode tests the resilience of the ETF product structure during periods of stress.
The data presents a contradiction. Fidelity's inflow suggests some institutions see value at these levels, while BlackRock's outflow indicates profit-taking or risk reduction. Market structure suggests this is more about internal rebalancing than a fundamental shift in sentiment. The key will be whether the $86,500 support holds. If it breaks, we could see accelerated outflows as the fair value gap below gets filled.
— CoinMarketBuzz Intelligence Desk
Two data-backed technical scenarios emerge from current market structure.
The 12-month institutional outlook depends on macroeconomic factors. If ETF flows stabilize and turn positive, Bitcoin could resume its upward trajectory toward six figures. However, persistent outflows would indicate deeper institutional skepticism. Historical cycles suggest that ETF flow trends often precede price movements by 2-3 weeks, making this a critical leading indicator.

Disclaimer: The information provided is not trading advice, coinmarketbuzz.com holds no liability for any investments made based on the information provided on this page. We strongly recommend independent research and/or consultation with a qualified professional before making any investment decisions.
coinmarketbuzz.com leverages advanced AI technology to analyze market data. All content is fact-checked and reviewed by our editorial team to ensure accuracy and neutrality.