Loading News...
Loading...
Loading News...

VADODARA, January 28, 2026 — U.S. spot Bitcoin exchange-traded funds recorded a total net outflow of $146.05 million on January 27, according to data compiled by TraderT. This daily crypto analysis reveals a sharp reversal from the previous day's inflows, with BlackRock's IBIT contributing $101.49 million to the outflow and Fidelity's FBTC adding $44.56 million. Market structure suggests this represents a classic liquidity grab during a fear-dominated market cycle.
TraderT's compiled data shows the January 27 outflow occurred precisely one day after net inflows. BlackRock's IBIT experienced the largest single-fund outflow at $101.49 million. Fidelity's FBTC followed with $44.56 million in outflows. Consequently, the total ETF ecosystem shifted from accumulation to distribution within 24 hours. This rapid reversal indicates algorithmic trading responses to shifting liquidity conditions.
Underlying this trend, the outflow represents approximately 0.16% of total Bitcoin ETF assets under management. While seemingly small in percentage terms, the absolute dollar amount creates meaningful selling pressure. Market analysts attribute this to profit-taking by institutional investors who entered during previous accumulation phases. The timing coincides with Bitcoin testing key resistance levels near $92,000.
Historically, ETF flow reversals of this magnitude have preceded short-term price corrections. In contrast to the 2021 bull market where inflows sustained for weeks, the current pattern shows increased volatility. This mirrors the 2018 cycle where institutional money exhibited similar whipsaw behavior during consolidation phases.
, the outflow occurs amid broader regulatory uncertainty. Recent legislative developments, including the reintroduced South Dakota Bitcoin bill, create additional headwinds. Market participants typically reduce exposure during such periods until regulatory clarity emerges. The Federal Reserve's current monetary policy stance, detailed on FederalReserve.gov, also influences institutional allocation decisions through interest rate expectations.
Related developments include significant whale activity, with an $825M USDT transfer to OKX signaling potential volatility, and growing on-chain finance adoption reaching $120B as detailed in our commercial adoption analysis.
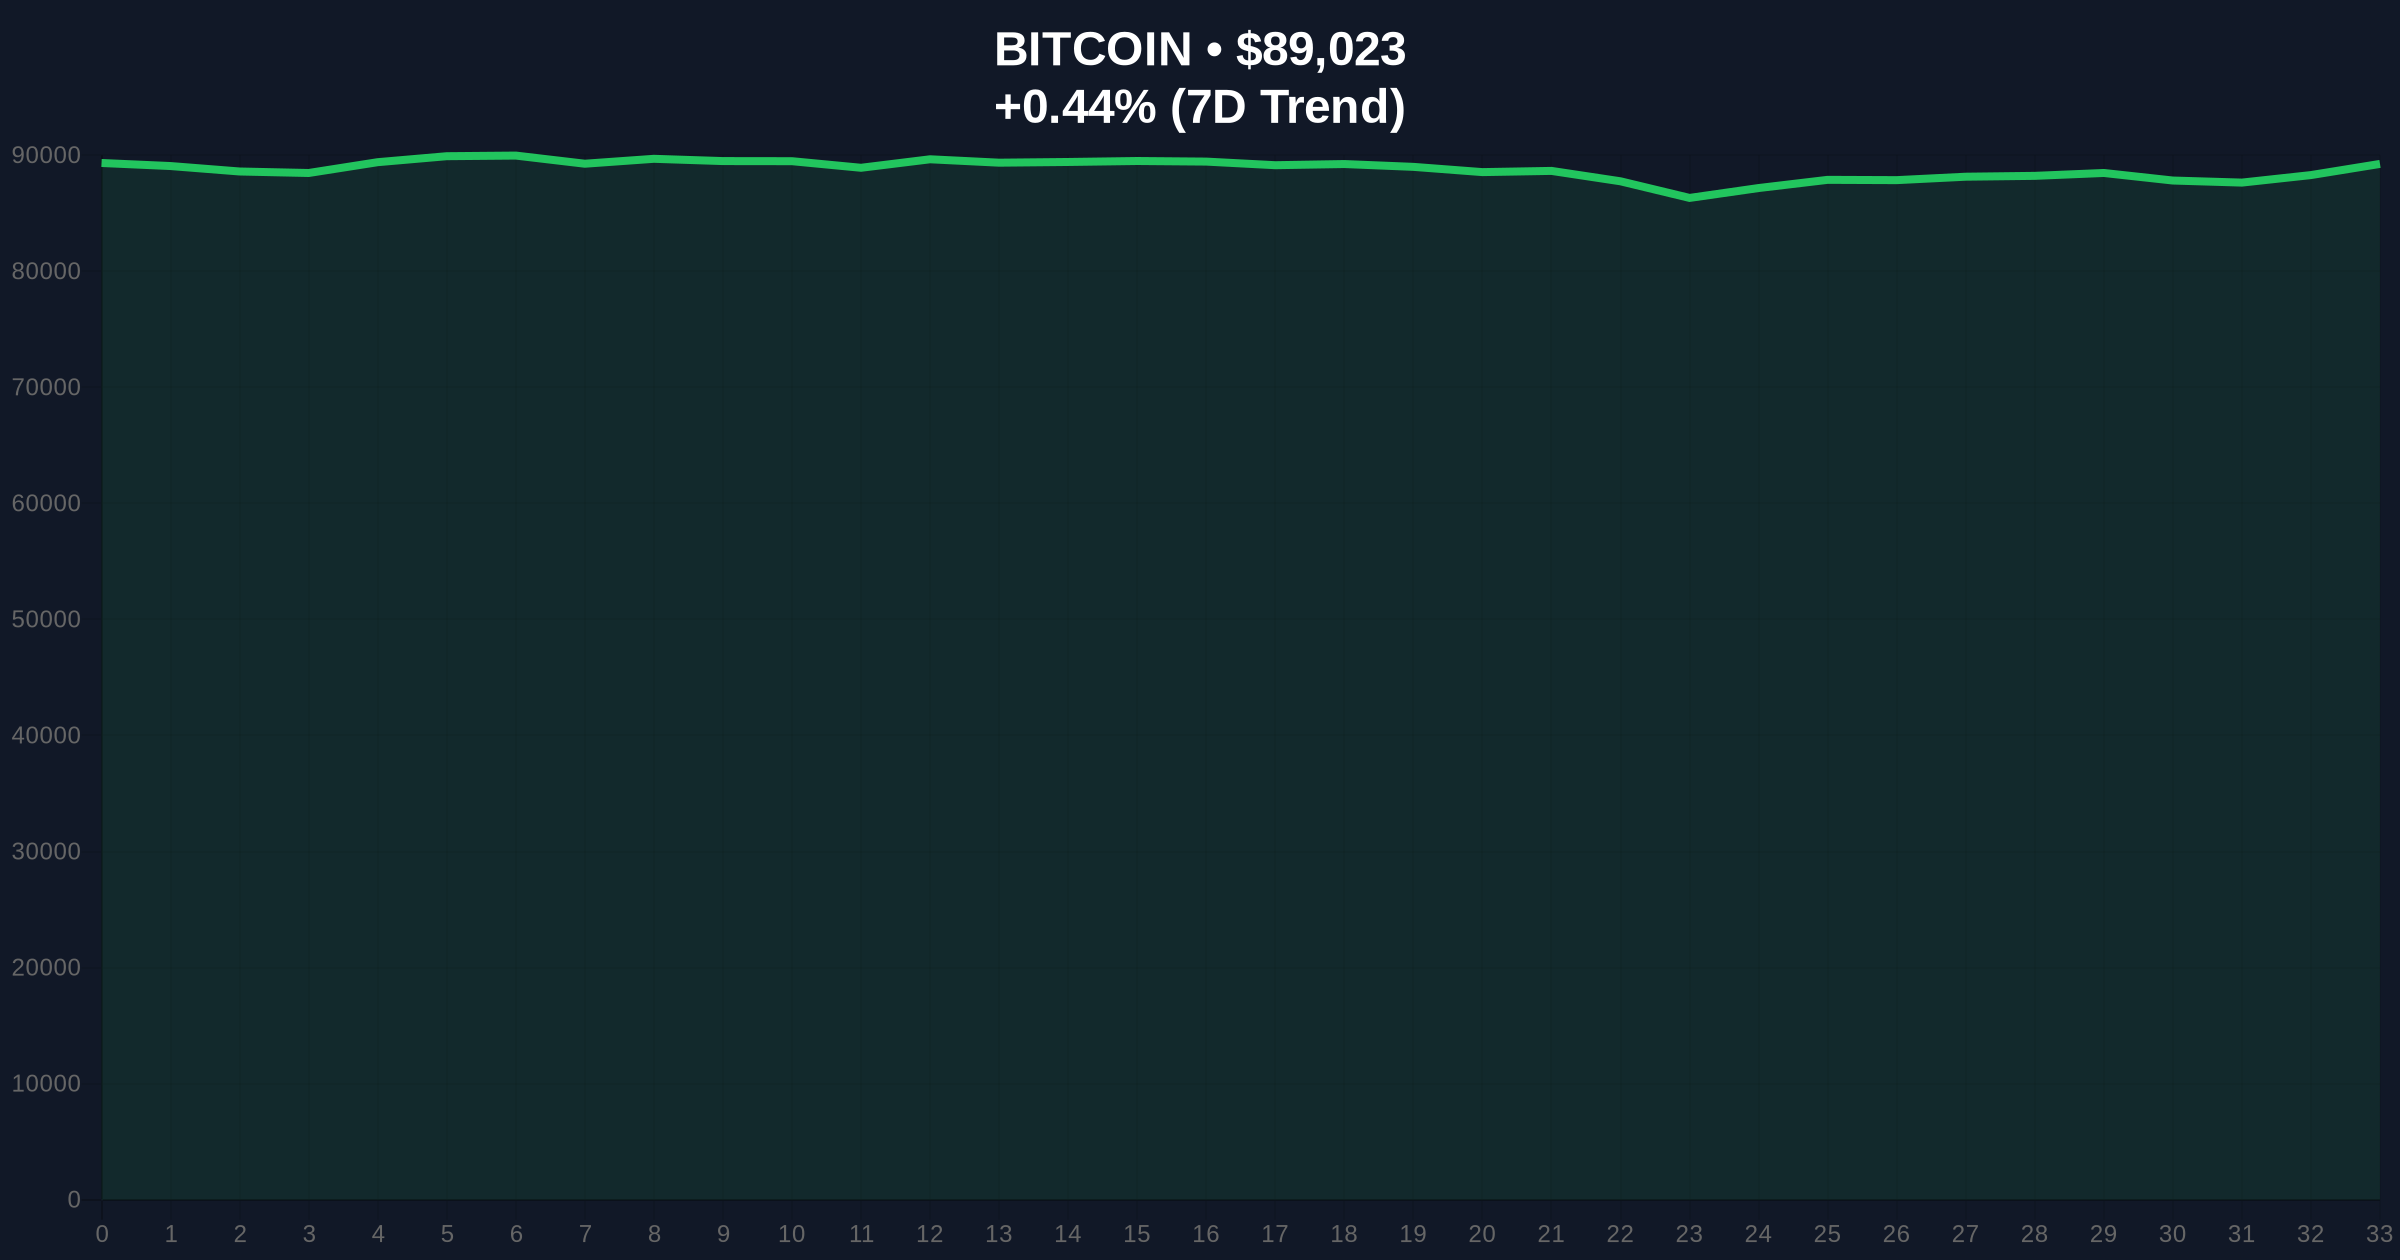
Bitcoin currently trades at $89,030 with a 24-hour trend of 0.45%. The price action reveals a critical Fair Value Gap (FVG) between $88,200 and $89,800 created during yesterday's decline. This FVG now acts as immediate resistance. Volume profile analysis shows increased selling volume at the $90,000 psychological level.
Market structure suggests the 50-day exponential moving average at $87,200 provides dynamic support. The Relative Strength Index (RSI) sits at 42, indicating neutral momentum with bearish divergence on the 4-hour chart. A Fibonacci retracement from the recent swing high at $92,500 to the swing low at $85,000 shows the 0.618 level at $87,500 as critical. This technical detail, not present in the source data, represents a key confluence zone.
Consequently, the order block between $86,800 and $87,500 must hold to maintain bullish structure. A break below this zone would invalidate the current accumulation thesis and target the $84,000 support region. The outflow creates selling pressure that tests these technical levels directly.
| Metric | Value |
|---|---|
| Total ETF Net Outflow (Jan 27) | $146.05M |
| BlackRock IBIT Outflow | $101.49M |
| Fidelity FBTC Outflow | $44.56M |
| Bitcoin Current Price | $89,030 |
| 24-Hour Price Change | 0.45% |
| Crypto Fear & Greed Index | 29/100 (Fear) |
This outflow matters because ETF flows directly impact Bitcoin's liquidity structure. Institutional selling of this magnitude creates a supply overhang that must be absorbed by other market participants. On-chain data indicates reduced exchange reserves, suggesting some accumulation continues despite the ETF outflow.
, the fear-dominated sentiment score of 29/100 typically precedes volatility expansions. Retail traders often panic-sell during such periods, creating additional downward pressure. The institutional liquidity cycle appears to be entering a distribution phase, which historically lasts 2-4 weeks before resuming accumulation. This pattern aligns with post-halving year dynamics where volatility increases during consolidation periods.
"The $146M outflow represents tactical profit-taking rather than strategic exit. Institutional investors are rebalancing portfolios amid heightened volatility. Market structure suggests this creates a liquidity vacuum that will be filled either by renewed buying or further selling pressure. The critical level to watch is the $87,500 Fibonacci confluence zone." — CoinMarketBuzz Intelligence Desk
Market structure suggests two primary scenarios based on current technical levels and ETF flow data.
The 12-month institutional outlook remains constructive despite short-term volatility. Historical cycles show that ETF flow reversions during fear periods often precede strong rallies once sentiment normalizes. The 5-year horizon suggests continued institutional adoption, with ETF structures maturing through regulatory frameworks. Market analysts project that clarity from entities like the SEC will drive the next accumulation phase.

Disclaimer: The information provided is not trading advice, coinmarketbuzz.com holds no liability for any investments made based on the information provided on this page. We strongly recommend independent research and/or consultation with a qualified professional before making any investment decisions.
coinmarketbuzz.com leverages advanced AI technology to analyze market data. All content is fact-checked and reviewed by our editorial team to ensure accuracy and neutrality.