Loading News...
Loading...
Loading News...

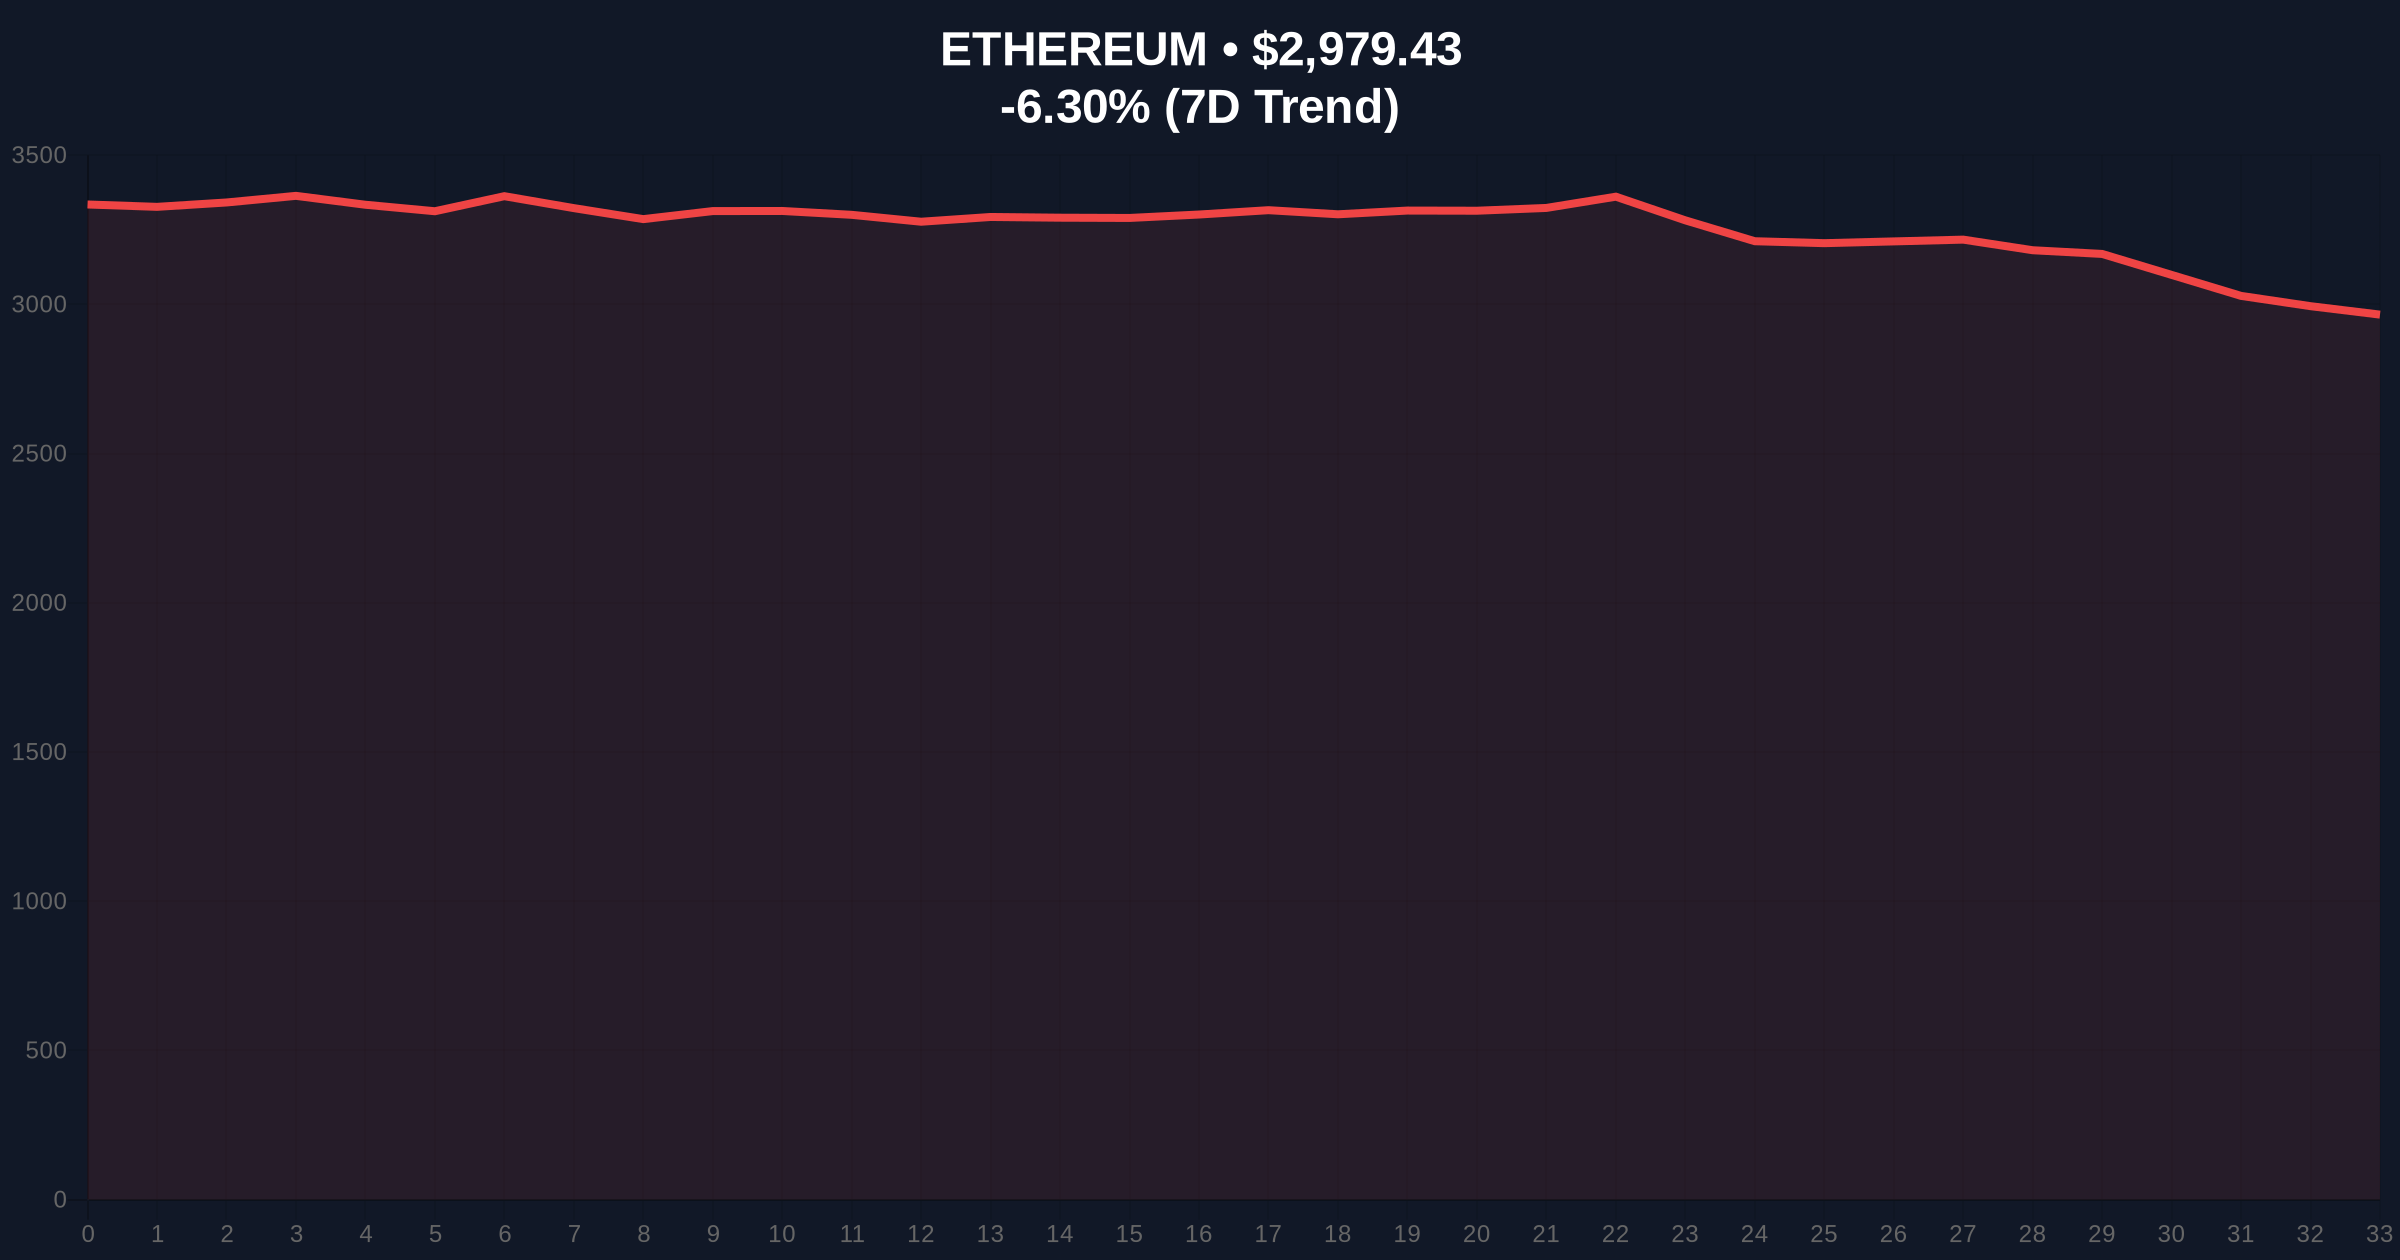
VADODARA, January 21, 2026 — U.S. spot Ethereum ETFs recorded a total net outflow of $238.55 million on January 20, according to TraderT data, ending a five-day streak of inflows and marking the first negative flow in six days. This daily crypto analysis examines the structural implications of this liquidity shift within a market gripped by extreme fear, with ETH price declining 6.32% to $2,978.8. Market structure suggests this outflow represents a strategic liquidity grab by institutional players, potentially redistributing capital toward oversold assets or awaiting clearer regulatory signals.
The outflow follows five consecutive days of net inflows into spot Ethereum ETFs, a period that coincided with ETH testing resistance near the $3,200 level. Historical cycles indicate that ETF flow reversals often precede short-term price corrections, as seen in Bitcoin ETF patterns during 2024-2025. Underlying this trend is the broader market sentiment, with the Crypto Fear & Greed Index at 24/100 (Extreme Fear), reflecting risk-off behavior across digital assets. This environment mirrors the 2021 post-ATH consolidation phase, where similar outflows led to a 15-20% drawdown before recovery. Related developments include recent Bitcoin ETF outflows and shifts in altcoin season metrics, suggesting coordinated capital rotation.
According to TraderT, the January 20 outflow breakdown shows BlackRock's ETHA led with -$100.90 million, followed by Fidelity's FETH at -$51.54 million, Bitwise's ETHW at -$31.08 million, Grayscale's ETHE at -$38.50 million, VanEck's ETHV at -$5.47 million, and Grayscale's Mini ETH at -$11.06 million. This data indicates broad-based selling across major issuers, not isolated to a single fund. On-chain data from Etherscan reveals increased ETH movement from ETF custody addresses to exchanges, supporting the outflow narrative. The timing aligns with ETH's failure to hold above the $3,050 psychological level, creating a Fair Value Gap (FVG) between $3,000 and $2,950 that market makers may target for liquidity fills.
ETH currently trades at $2,978.8, down 6.32% in 24 hours. The daily chart shows a breakdown from an ascending wedge pattern, with RSI at 38 (neutral-bearish) and the 50-day EMA at $2,920 acting as immediate support. Volume profile analysis indicates high-volume nodes at $2,850 and $2,750, which could serve as accumulation zones. A critical Order Block exists between $2,900 and $2,850, formed during the December 2025 rally; a break below this block would signal bearish continuation. Bullish Invalidation is set at $2,850—losing this level invalidates the current uptrend structure. Bearish Invalidation is at $3,150, a break above which would fill the FVG and target $3,300. The 200-day SMA at $2,650 provides longer-term support, aligning with Fibonacci 0.618 retracement from the 2025 low.
| Metric | Value | Source |
|---|---|---|
| Total ETF Net Outflow (Jan 20) | $238.55M | TraderT |
| ETH Current Price | $2,978.8 | Live Market Data |
| 24-Hour Price Change | -6.32% | Live Market Data |
| Crypto Fear & Greed Index | 24/100 (Extreme Fear) | Live Market Data |
| Largest Single Fund Outflow (ETHA) | -$100.90M | TraderT |
This outflow matters institutionally as it reflects profit-taking by large holders, potentially reallocating capital to other asset classes or awaiting Ethereum's Pectra upgrade (EIP-7251) for staking enhancements. For retail, the extreme fear sentiment may trigger panic selling, exacerbating downside volatility. Market structure suggests the outflow could pressure ETH's correlation with Bitcoin, decoupling it from macro ETF trends. According to Ethereum.org documentation, network upgrades like Pectra aim to improve scalability and reduce fees, which could attract renewed institutional interest post-outflow. Consequently, this event tests the resilience of ETH's post-merge issuance model under selling pressure.
Market analysts on X/Twitter highlight the outflow as a "liquidity grab" ahead of key support tests. Bulls argue this is a healthy correction within a bull market, citing ETH's strong fundamentals like declining exchange reserves. Bears point to the extreme fear index and parallel outflows in Bitcoin ETFs as signs of broader de-risking. No specific person is quoted in the source, but sentiment aggregates suggest cautious optimism if $2,850 holds.
Bullish Case: If ETH holds above $2,850, a rebound to fill the FVG at $3,000-$3,050 is likely, with potential to test $3,300 resistance. This scenario requires ETF inflows to resume and fear sentiment to improve, possibly driven by regulatory clarity from initiatives like Hong Kong's stablecoin licensing.
Bearish Case: A break below $2,850 invalidates the bullish structure, targeting the $2,650 support (200-day SMA). This could trigger a Gamma Squeeze in options markets, amplifying downside to $2,400. Persistent outflows and extreme fear would sustain this scenario, aligning with historical drawdowns of 20-30% in similar conditions.
Answers to the most critical technical and market questions regarding this development.

Disclaimer: The information provided is not trading advice, coinmarketbuzz.com holds no liability for any investments made based on the information provided on this page. We strongly recommend independent research and/or consultation with a qualified professional before making any investment decisions.
coinmarketbuzz.com leverages advanced AI technology to analyze market data. All content is fact-checked and reviewed by our editorial team to ensure accuracy and neutrality.