Loading News...
Loading...
Loading News...

VADODARA, February 4, 2026 — Ethereum (ETH) risks breaking below the critical $2,000 support level this month. Bearish technical patterns and deteriorating on-chain metrics drive this outlook. According to Cointelegraph analysis, ETH has entered the breakdown phase of an inverse cup and handle pattern. This classic bearish signal suggests a potential 25% decline to $1,665 by early next month. Market structure indicates extreme fear, with the Global Crypto Fear & Greed Index at 14/100. This latest crypto news highlights mounting pressure on the second-largest cryptocurrency.
Cointelegraph reports ETH price has fallen approximately 60% from its high last August. The asset now trades below the inverse cup and handle pattern's neckline of $2,960. This level acts as major resistance, contributing to the renewed downtrend. ETH also faces strong resistance below its 20-day and 50-day moving averages on the daily chart. On-chain data from MVRV bands supports this bearish outlook. The metrics indicate a possible drop to $1,725 or lower. Investors are reducing exposure, fearing a repeat of the crypto market's four-year cycle. Concerns over a potential AI bubble burst amplify risk-off sentiment for crypto assets.
Historically, inverse cup and handle patterns have preceded significant declines. Similar patterns appeared during the 2018 bear market and the 2021 correction. In contrast, the current setup mirrors the 2019 breakdown that led to a 40% drop. Underlying this trend is the four-year cycle theory, which suggests a prolonged bear phase. Market analysts point to parallels with the 2022 downturn, where ETH fell from $4,800 to below $1,000. The current extreme fear sentiment, as seen in the recent analysis of Binance's SAFU buy, shows minimal price impact amid similar conditions. , regulatory uncertainty, like the South Korean opposition's challenge to exchange caps, adds to market headwinds.
Market structure suggests ETH faces a critical test at the $2,000 psychological support. A break below this level would confirm the inverse cup and handle pattern. This could open a path to the $1,665 target, representing a 25% decline. The 20-day and 50-day moving averages now act as dynamic resistance zones. RSI readings on the daily chart hover near oversold levels, but divergence signals remain weak. Volume profile analysis shows increased selling pressure near the $2,960 neckline. Fibonacci retracement levels from the 2025 high indicate potential support at $1,800 (0.786 level). UTXO age bands reveal long-term holders are distributing, adding to sell-side liquidity.
| Metric | Value | Implication |
|---|---|---|
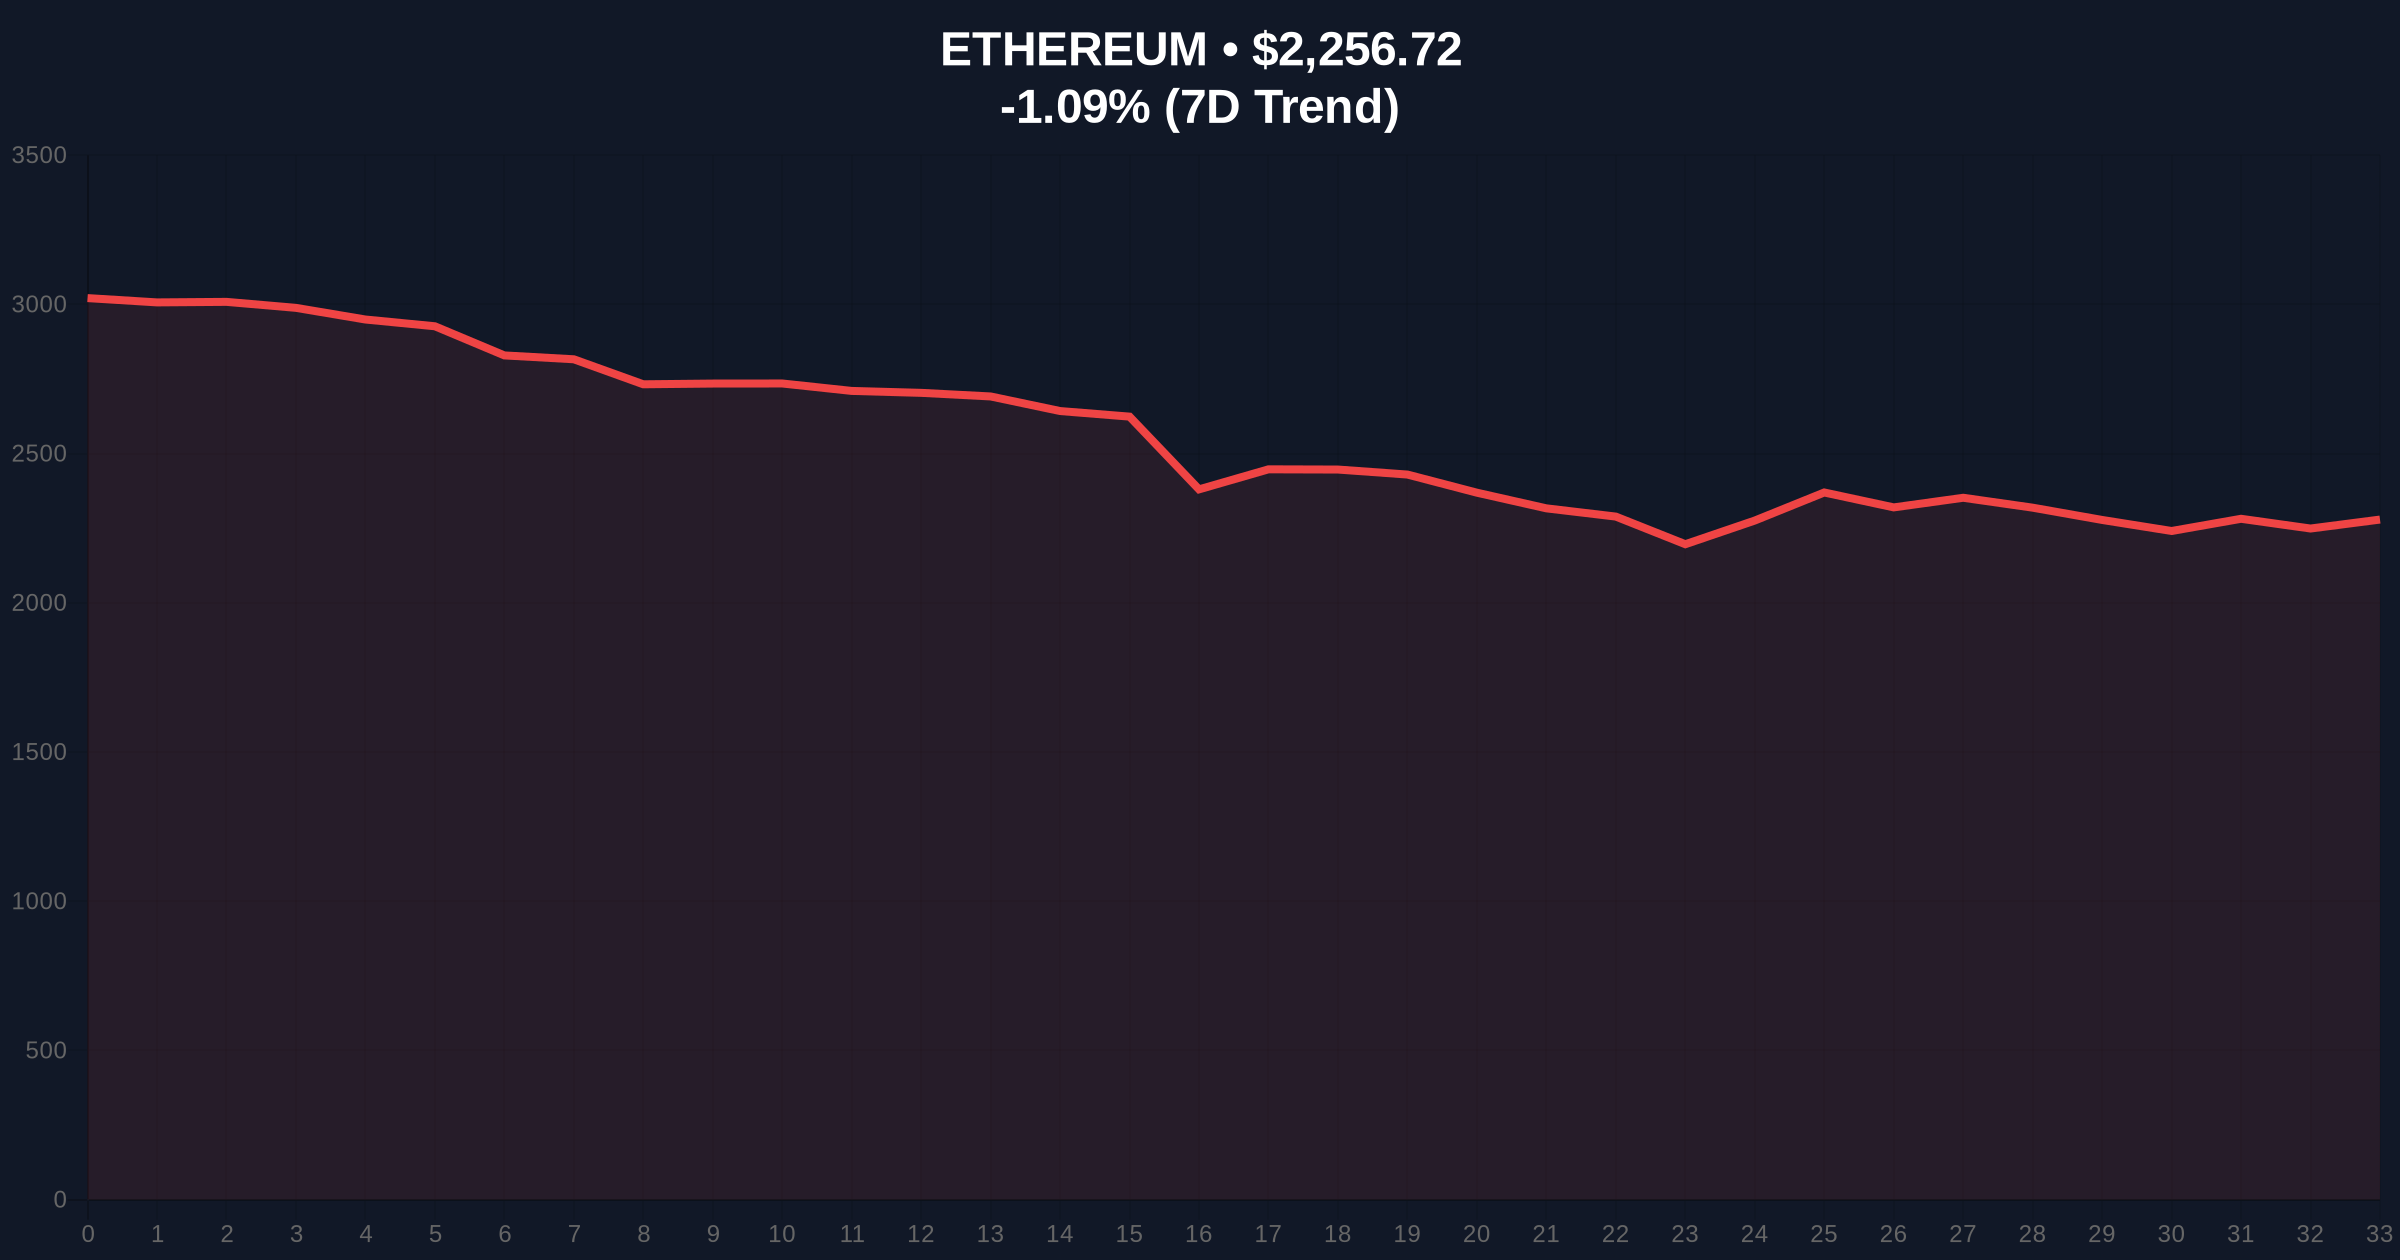
| Current ETH Price | $2,256.72 | Below key moving averages |
| 24-Hour Trend | -1.09% | Continued downward momentum |
| Market Rank | #2 | Maintains position but under pressure |
| Crypto Fear & Greed Index | 14/100 (Extreme Fear) | High risk-off sentiment |
| Target Price (MVRV Bands) | $1,725 or lower | Potential 23.5% decline |
This potential breakdown matters for portfolio risk management. A drop below $2,000 could trigger stop-loss orders and liquidations. Institutional liquidity cycles may shift if ETH loses this key support. Retail market structure shows increased fear, similar to periods before major corrections. On-chain forensic data confirms deteriorating metrics, such as declining network activity and rising exchange inflows. The broader crypto ecosystem, including projects highlighted in studies on fraudulent promotions, faces heightened scrutiny. Regulatory developments, like those tracked on SEC.gov, could further impact sentiment.
Market analysts note the inverse cup and handle pattern is a reliable bearish indicator. The breakdown below $2,960 suggests renewed selling pressure. On-chain metrics like MVRV bands support a further decline. Investors should monitor the $2,000 level closely.
Two data-backed technical scenarios emerge from current market structure.
The 12-month institutional outlook depends on ETH holding key supports. Historical cycles suggest a potential bottom formation near $1,600-$1,800 if the bearish scenario plays out. Over a 5-year horizon, network upgrades like EIP-4844 could drive recovery, but short-term risks remain elevated.

Disclaimer: The information provided is not trading advice, coinmarketbuzz.com holds no liability for any investments made based on the information provided on this page. We strongly recommend independent research and/or consultation with a qualified professional before making any investment decisions.
coinmarketbuzz.com leverages advanced AI technology to analyze market data. All content is fact-checked and reviewed by our editorial team to ensure accuracy and neutrality.