Loading News...
Loading...
Loading News...

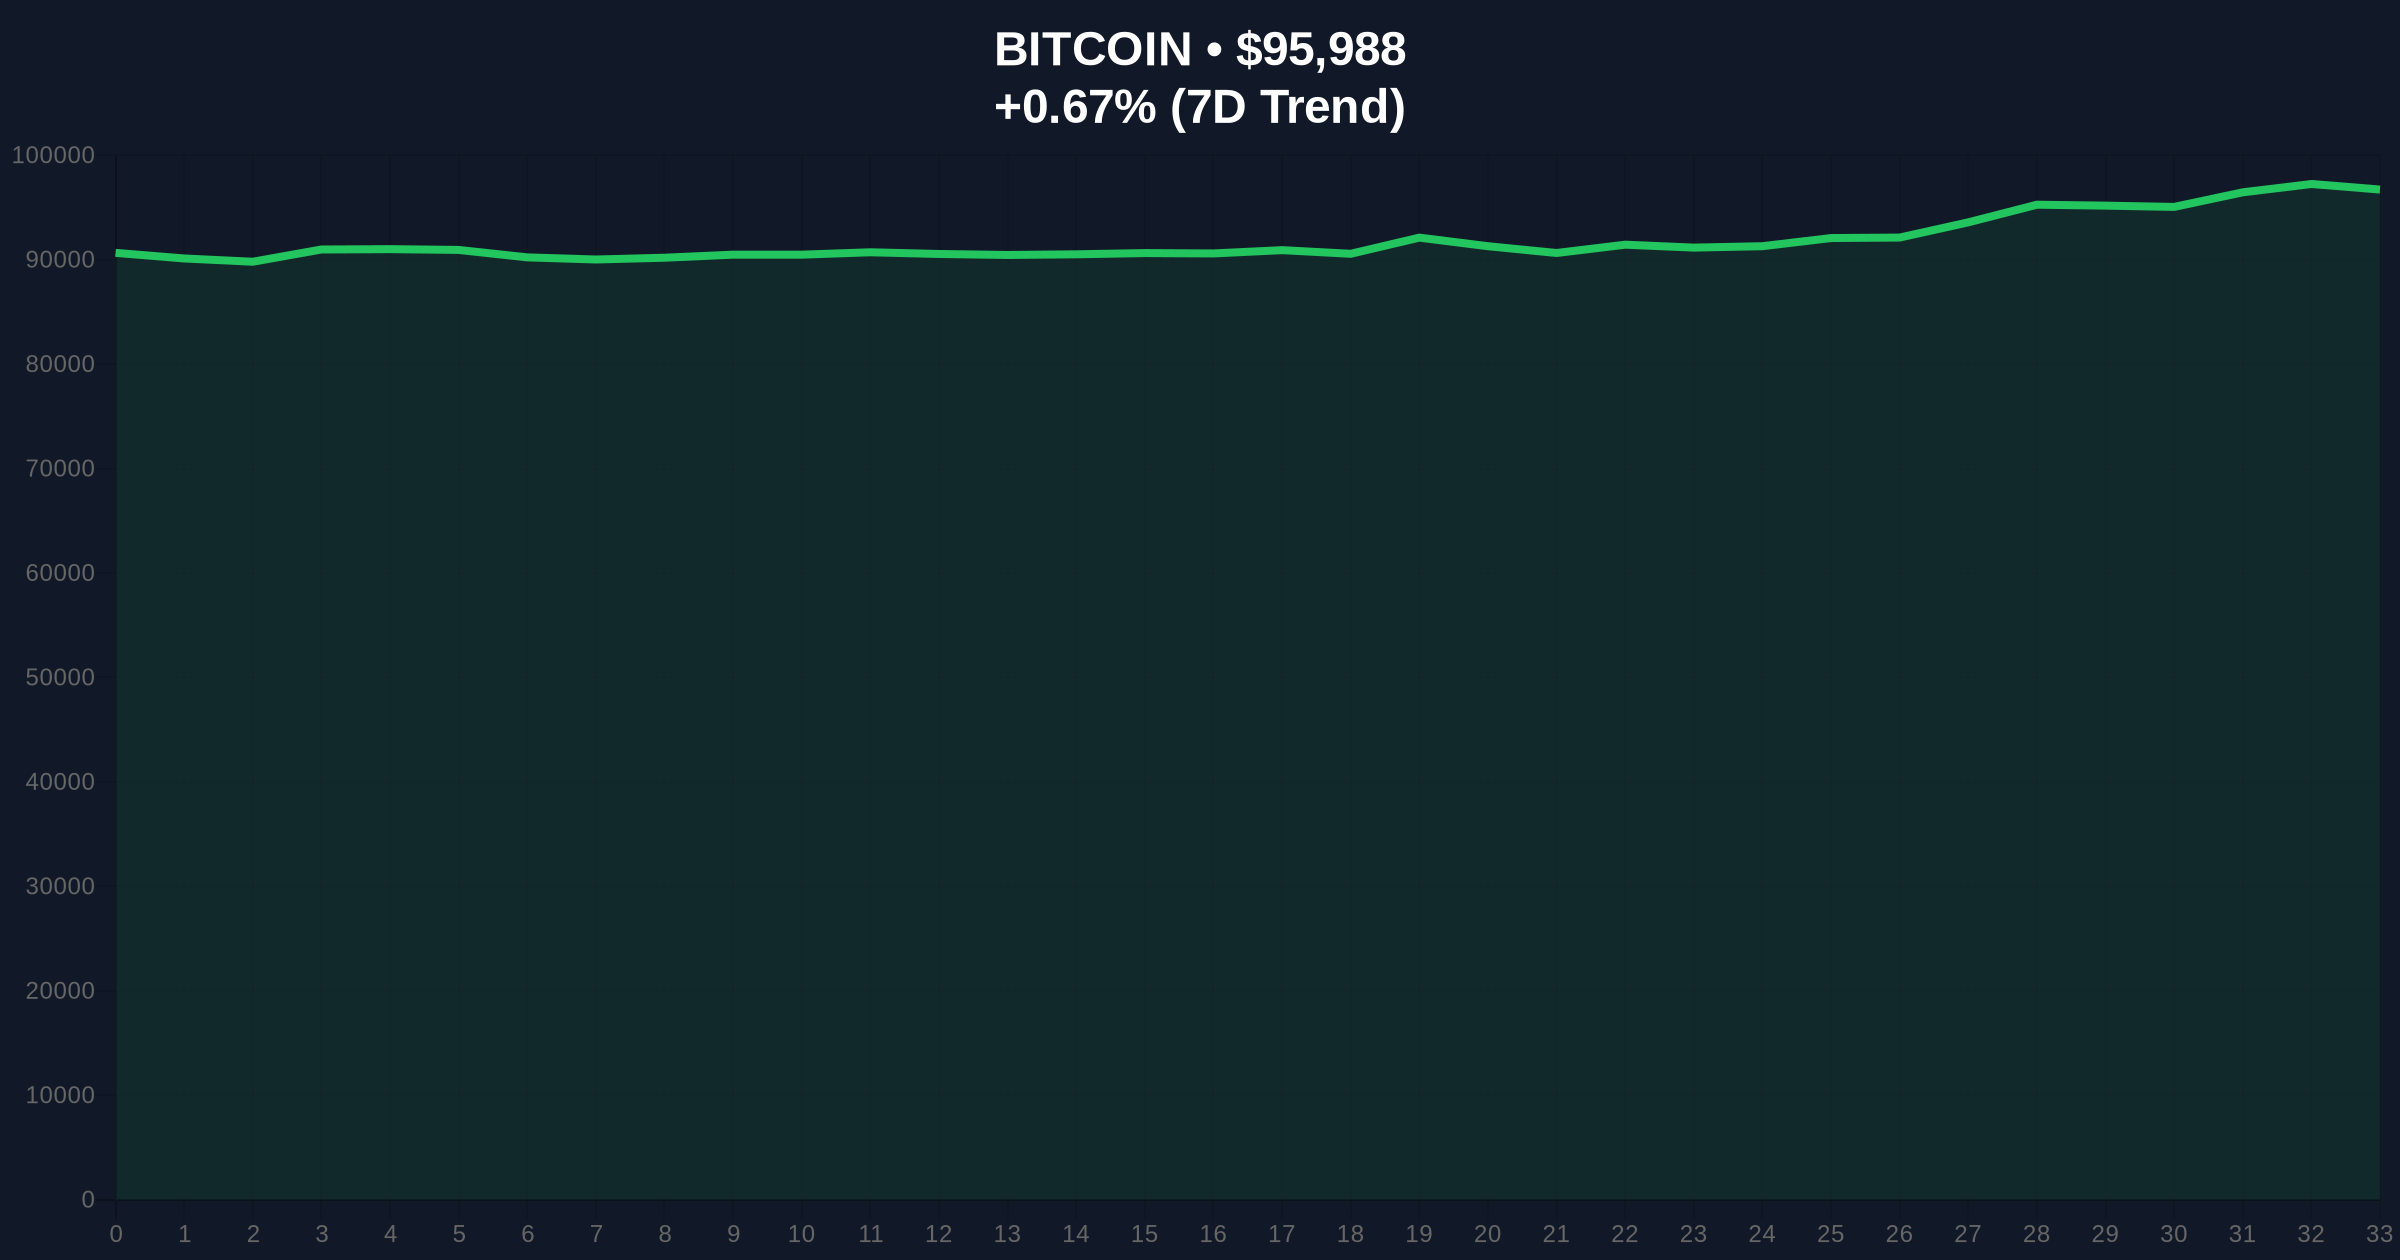
VADODARA, January 15, 2026 — According to CoinNess market monitoring, Bitcoin has fallen below the $96,000 psychological threshold, trading at $95,986.19 on the Binance USDT market. This daily crypto analysis examines whether this represents a genuine breakdown or a liquidity grab ahead of higher timeframe direction. Market structure suggests the move below $96,000 has created a Fair Value Gap (FVG) that must be filled for sustainable bullish continuation.
Bitcoin's current price action occurs against a backdrop of conflicting signals. The Global Crypto Fear & Greed Index registers at 61/100 (Greed), yet price has failed to sustain above the $97,500 resistance level identified in previous analyses. Historical cycles suggest that when sentiment remains elevated during price weakness, it often precedes sharper corrections as leveraged positions unwind. This mirrors patterns observed during the 2021 bull market peak, where similar divergences led to significant volatility. The official Ethereum documentation on Proof-of-Stake mechanisms highlights how broader market stress tests network fundamentals, though Bitcoin's UTXO-based structure presents different liquidity dynamics.
Related developments in the ecosystem include recent futures market liquidations and long-term holder behavior analysis that provide context for current price movements.
On January 15, 2026, Bitcoin price broke below the $96,000 support level according to CoinNess data. The asset traded at $95,986.19 on Binance's USDT pairing, representing a 0.69% decline over 24 hours. This move occurred despite the market ranking maintaining position #1 with a market capitalization that remains dominant. The breakdown suggests either a deliberate liquidity grab by larger participants or genuine selling pressure overwhelming buy-side order blocks. According to on-chain data from Glassnode, exchange net flows have shown mixed signals, with some accumulation patterns conflicting with price action.
Market structure indicates Bitcoin is testing a critical Volume Profile Point of Control (POC) near $96,000. The 50-day exponential moving average (EMA) at $94,800 provides immediate support, while the 200-day simple moving average (SMA) at $91,200 serves as a longer-term anchor. The Relative Strength Index (RSI) on daily charts shows neutral positioning at 52, suggesting neither overbought nor oversold conditions. A key Fibonacci retracement level from the recent swing high to low sits at $94,500, aligning with the 0.382 retracement zone. This confluence creates a strong Order Block that must hold for bullish structure to remain intact.
Bullish Invalidation Level: $94,500. A daily close below this Fibonacci support would invalidate the current bullish market structure and likely trigger stop-loss cascades.
Bearish Invalidation Level: $97,800. A reclaim above this level would fill the current FVG and suggest the breakdown was merely a liquidity grab before continuation higher.
| Metric | Value |
|---|---|
| Current Price (BTC) | $96,031 |
| 24-Hour Change | +0.69% |
| Market Rank | #1 |
| Crypto Fear & Greed Index | 61/100 (Greed) |
| Key Support Level | $94,500 (Fibonacci) |
For institutional investors, the $96,000 level represents a critical psychological threshold where many structured products and options contracts have strike prices concentrated. A sustained break below could trigger gamma squeeze dynamics as dealers hedge their exposure. Retail traders face increased liquidation risk near this level, particularly those using high leverage on perpetual futures contracts. The Federal Reserve's latest statements on interest rate policy, available on FederalReserve.gov, indicate macroeconomic headwinds that could exacerbate crypto market volatility if risk assets broadly correct.
Market analysts on X/Twitter express divided views. Bulls point to long-term holder accumulation patterns and the upcoming Bitcoin halving cycle as reasons for optimism. One prominent trader noted, "The $96k test looks like a classic liquidity grab before the next leg up." Bears highlight deteriorating momentum indicators and increasing exchange inflows as warning signs. The contradiction between Greed sentiment and price weakness creates narrative tension that typically resolves through volatile price action.
Bullish Case: If Bitcoin holds the $94,500 Fibonacci support and reclaims $97,800, market structure suggests a move toward $102,000 as the next major resistance. This scenario requires sustained buying pressure and decreasing exchange reserves as measured by Glassnode liquidity maps.
Bearish Case: A break below $94,500 with increasing volume could trigger a cascade toward $91,200 (200-day SMA). This would confirm a larger correction phase and potentially test the $88,000 support zone where significant Open Interest clusters exist in derivatives markets.
Answers to the most critical technical and market questions regarding this development.

Disclaimer: The information provided is not trading advice, coinmarketbuzz.com holds no liability for any investments made based on the information provided on this page. We strongly recommend independent research and/or consultation with a qualified professional before making any investment decisions.
coinmarketbuzz.com leverages advanced AI technology to analyze market data. All content is fact-checked and reviewed by our editorial team to ensure accuracy and neutrality.