Loading News...
Loading...
Loading News...

VADODARA, January 15, 2026 — The MOVE Index, measuring U.S. Treasury volatility, has collapsed to 58. Its lowest reading since October 2021. This structural shift in fixed-income markets is creating a macro environment conducive to Bitcoin price action breaking above $100,000. According to analysis from CoinDesk, stable Treasury prices facilitate credit creation. This liquidity typically flows into risk assets. Market structure suggests a critical test of the psychological $100,000 resistance is imminent.
Bitcoin has maintained a negative correlation with the MOVE Index. When Treasury volatility falls, BTC tends to rise. The current MOVE level of 58 represents a four-year low. This mirrors conditions seen in late 2021 before Bitcoin's previous all-time high run. The Federal Reserve's current monetary policy stance, detailed in official Federal Reserve documentation, emphasizes stability. This reduces systemic risk premiums. Historical cycles suggest such environments trigger capital rotation from bonds to equities and crypto. Related developments include exchange liquidity grabs and altcoin infrastructure growth.
CoinDesk reported the analysis on January 15, 2026. The MOVE Index dropped to 58. This measures expected Treasury volatility over the next four weeks. The last time volatility was this low was October 2021. That period preceded Bitcoin's November 2021 all-time high near $69,000. The analysis indicates stable Treasury prices lower borrowing costs. This encourages credit expansion. Investors then increase exposure to risk assets like cryptocurrencies. The mechanism is straightforward: lower volatility in safe-haven assets pushes capital toward higher-yielding opportunities.
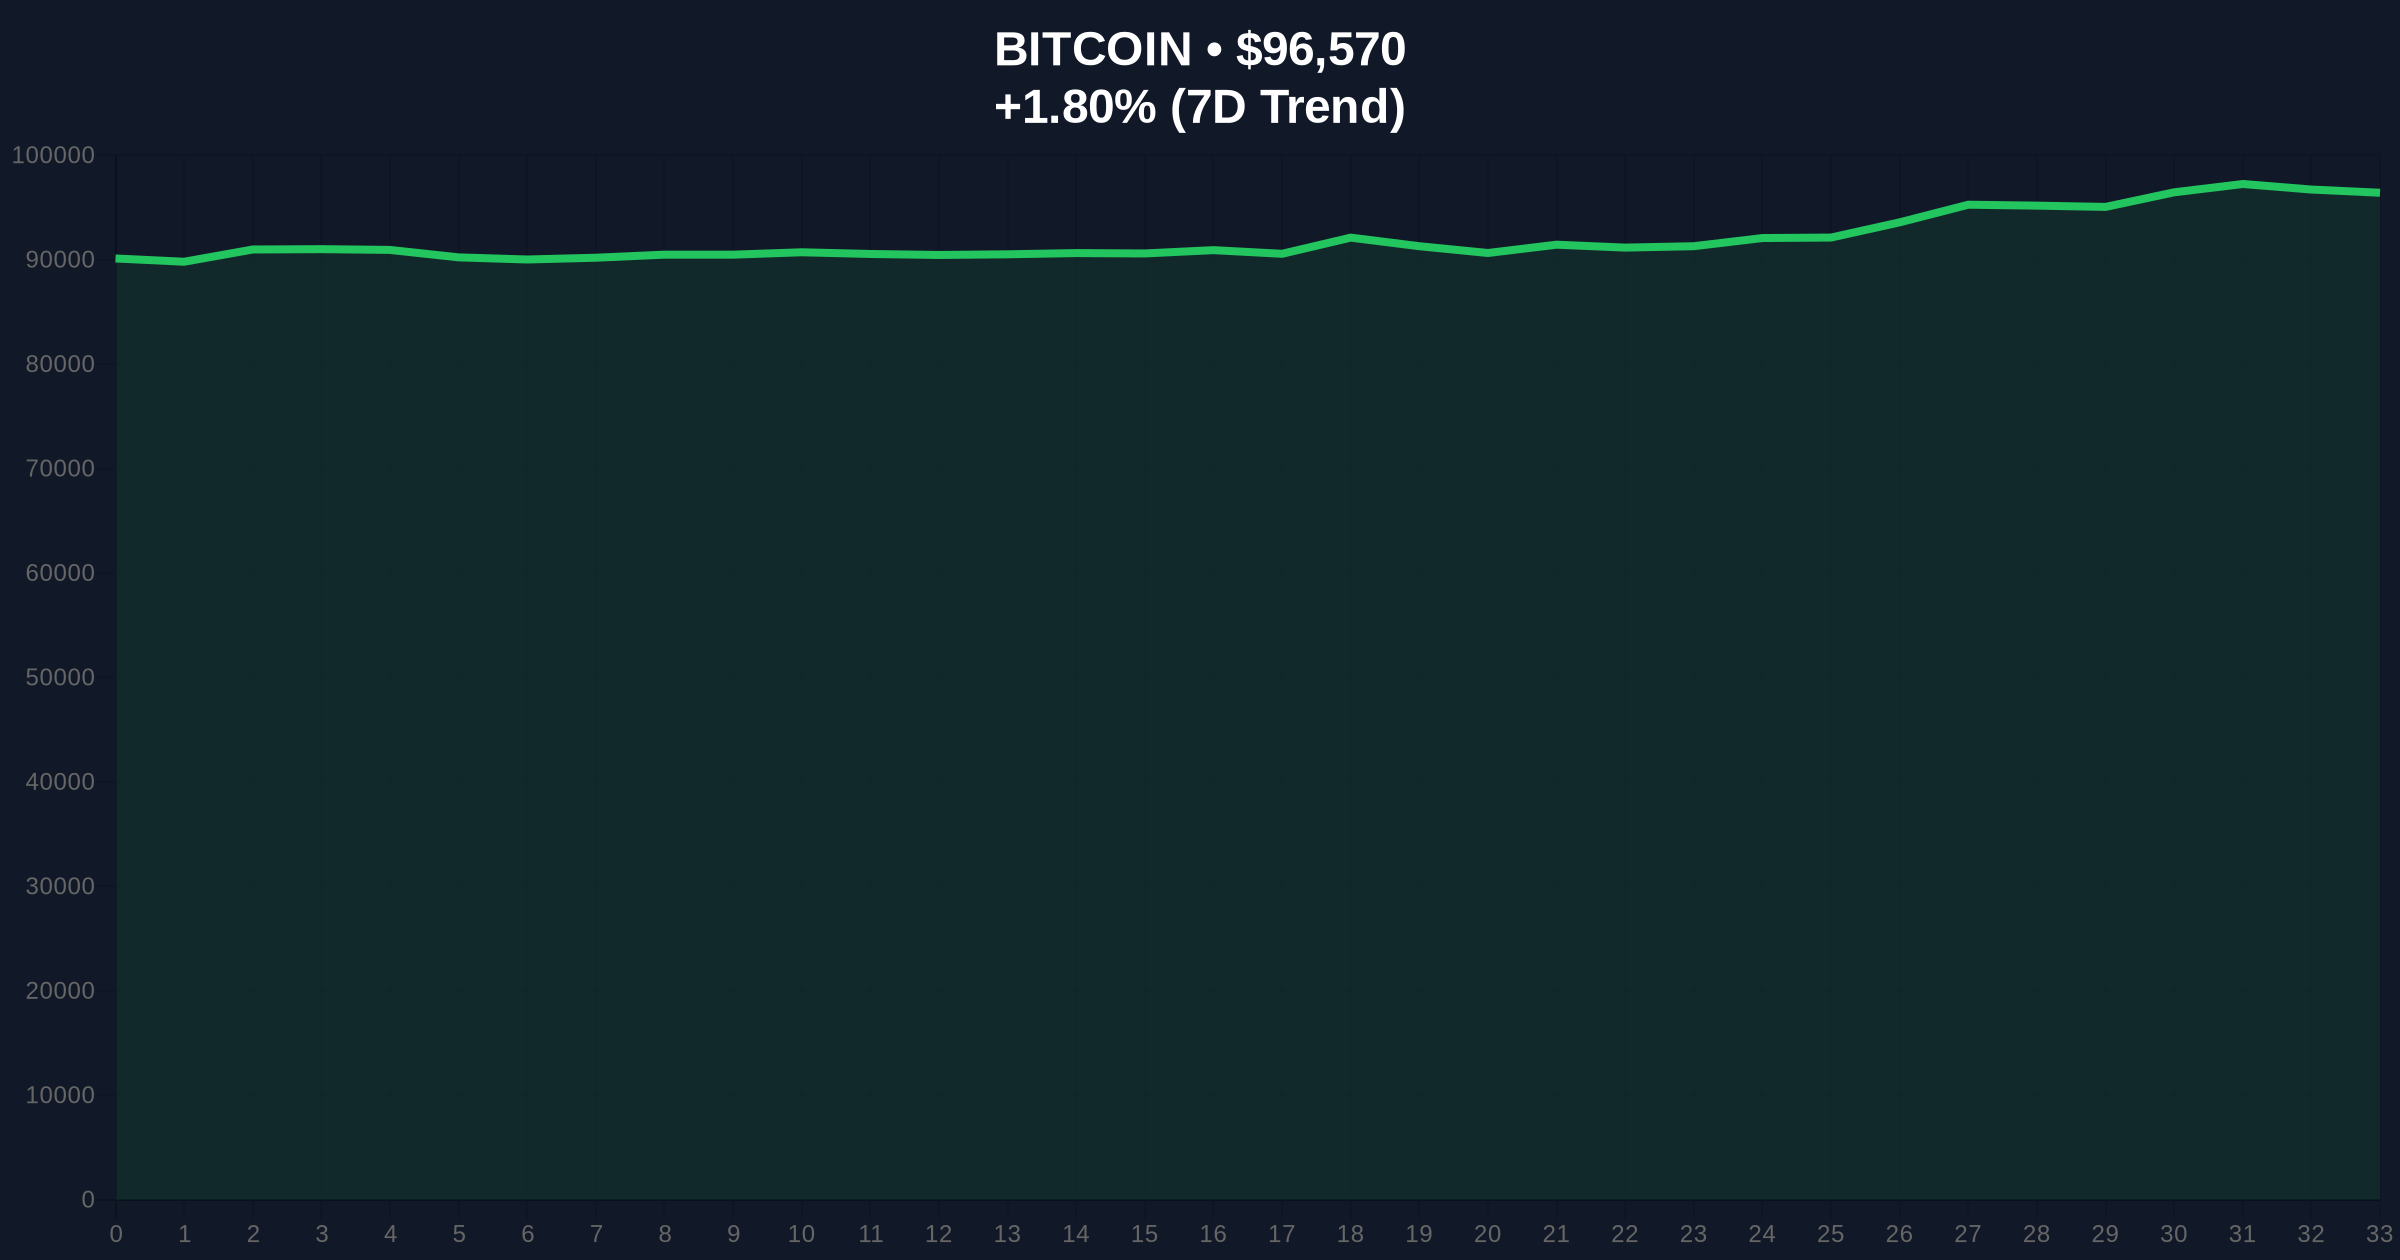
Bitcoin currently trades at $96,555. The daily chart shows consolidation above the $92,000 support cluster. This level coincides with a major Volume Profile Point of Control. A clear Fair Value Gap (FVG) exists between $94,500 and $95,800. This FVG must hold as support for continuation. The Relative Strength Index (RSI) reads 62. This indicates bullish momentum without overbought conditions. The 50-day Exponential Moving Average (EMA) at $91,200 provides dynamic support. Bullish Invalidation Level: $92,000. A break below this Order Block invalidates the uptrend structure. Bearish Invalidation Level: $101,500. A sustained close above this resistance confirms breakout momentum.
| Metric | Value | Significance |
|---|---|---|
| Bitcoin Current Price | $96,555 | Testing key resistance zone |
| 24-Hour Change | +1.79% | Positive momentum |
| Crypto Fear & Greed Index | 61 (Greed) | Moderate bullish sentiment |
| MOVE Index Level | 58 | 4-year low in Treasury volatility |
| Nasdaq 100 Correlation | Positive | Risk-on asset alignment |
This development matters for institutional portfolio allocation. Stable Treasuries reduce hedging costs for large funds. This frees capital for speculative positions. According to on-chain data, Bitcoin's network hash rate continues hitting record highs post the EIP-4844 implementation on Ethereum, signaling robust infrastructure investment. For retail, lower volatility in traditional markets reduces perceived systemic risk. This often triggers FOMO-driven inflows. The structural shift could accelerate Bitcoin's adoption as a macro hedge against future monetary policy uncertainty.
Market analysts on X/Twitter highlight the correlation breakdown. One quant noted, "MOVE at 58 is a statistical anomaly. This isn't just low volatility—it's complacency pricing." Bulls point to the negative correlation holding since 2020. Bears warn that suppressed volatility often precedes violent mean reversion. The consensus: the setup favors Bitcoin price action toward $100,000, but execution depends on liquidity conditions.
Bullish Case: Bitcoin breaks $100,000 within Q1 2026. The catalyst is sustained low Treasury volatility driving institutional reallocation. Technical targets extend to $112,000 based on Fibonacci extensions from the 2024 low. This scenario requires the $92,000 support to hold.
Bearish Case: A sudden spike in the MOVE Index triggers risk-off liquidation. Bitcoin fails at $100,000 resistance, creating a double-top pattern. Price retreats to test the $85,000 support zone. This invalidates the macro thesis and suggests correlation breakdown.
Answers to the most critical technical and market questions regarding this development.

Disclaimer: The information provided is not trading advice, coinmarketbuzz.com holds no liability for any investments made based on the information provided on this page. We strongly recommend independent research and/or consultation with a qualified professional before making any investment decisions.
coinmarketbuzz.com leverages advanced AI technology to analyze market data. All content is fact-checked and reviewed by our editorial team to ensure accuracy and neutrality.