Loading News...
Loading...
Loading News...

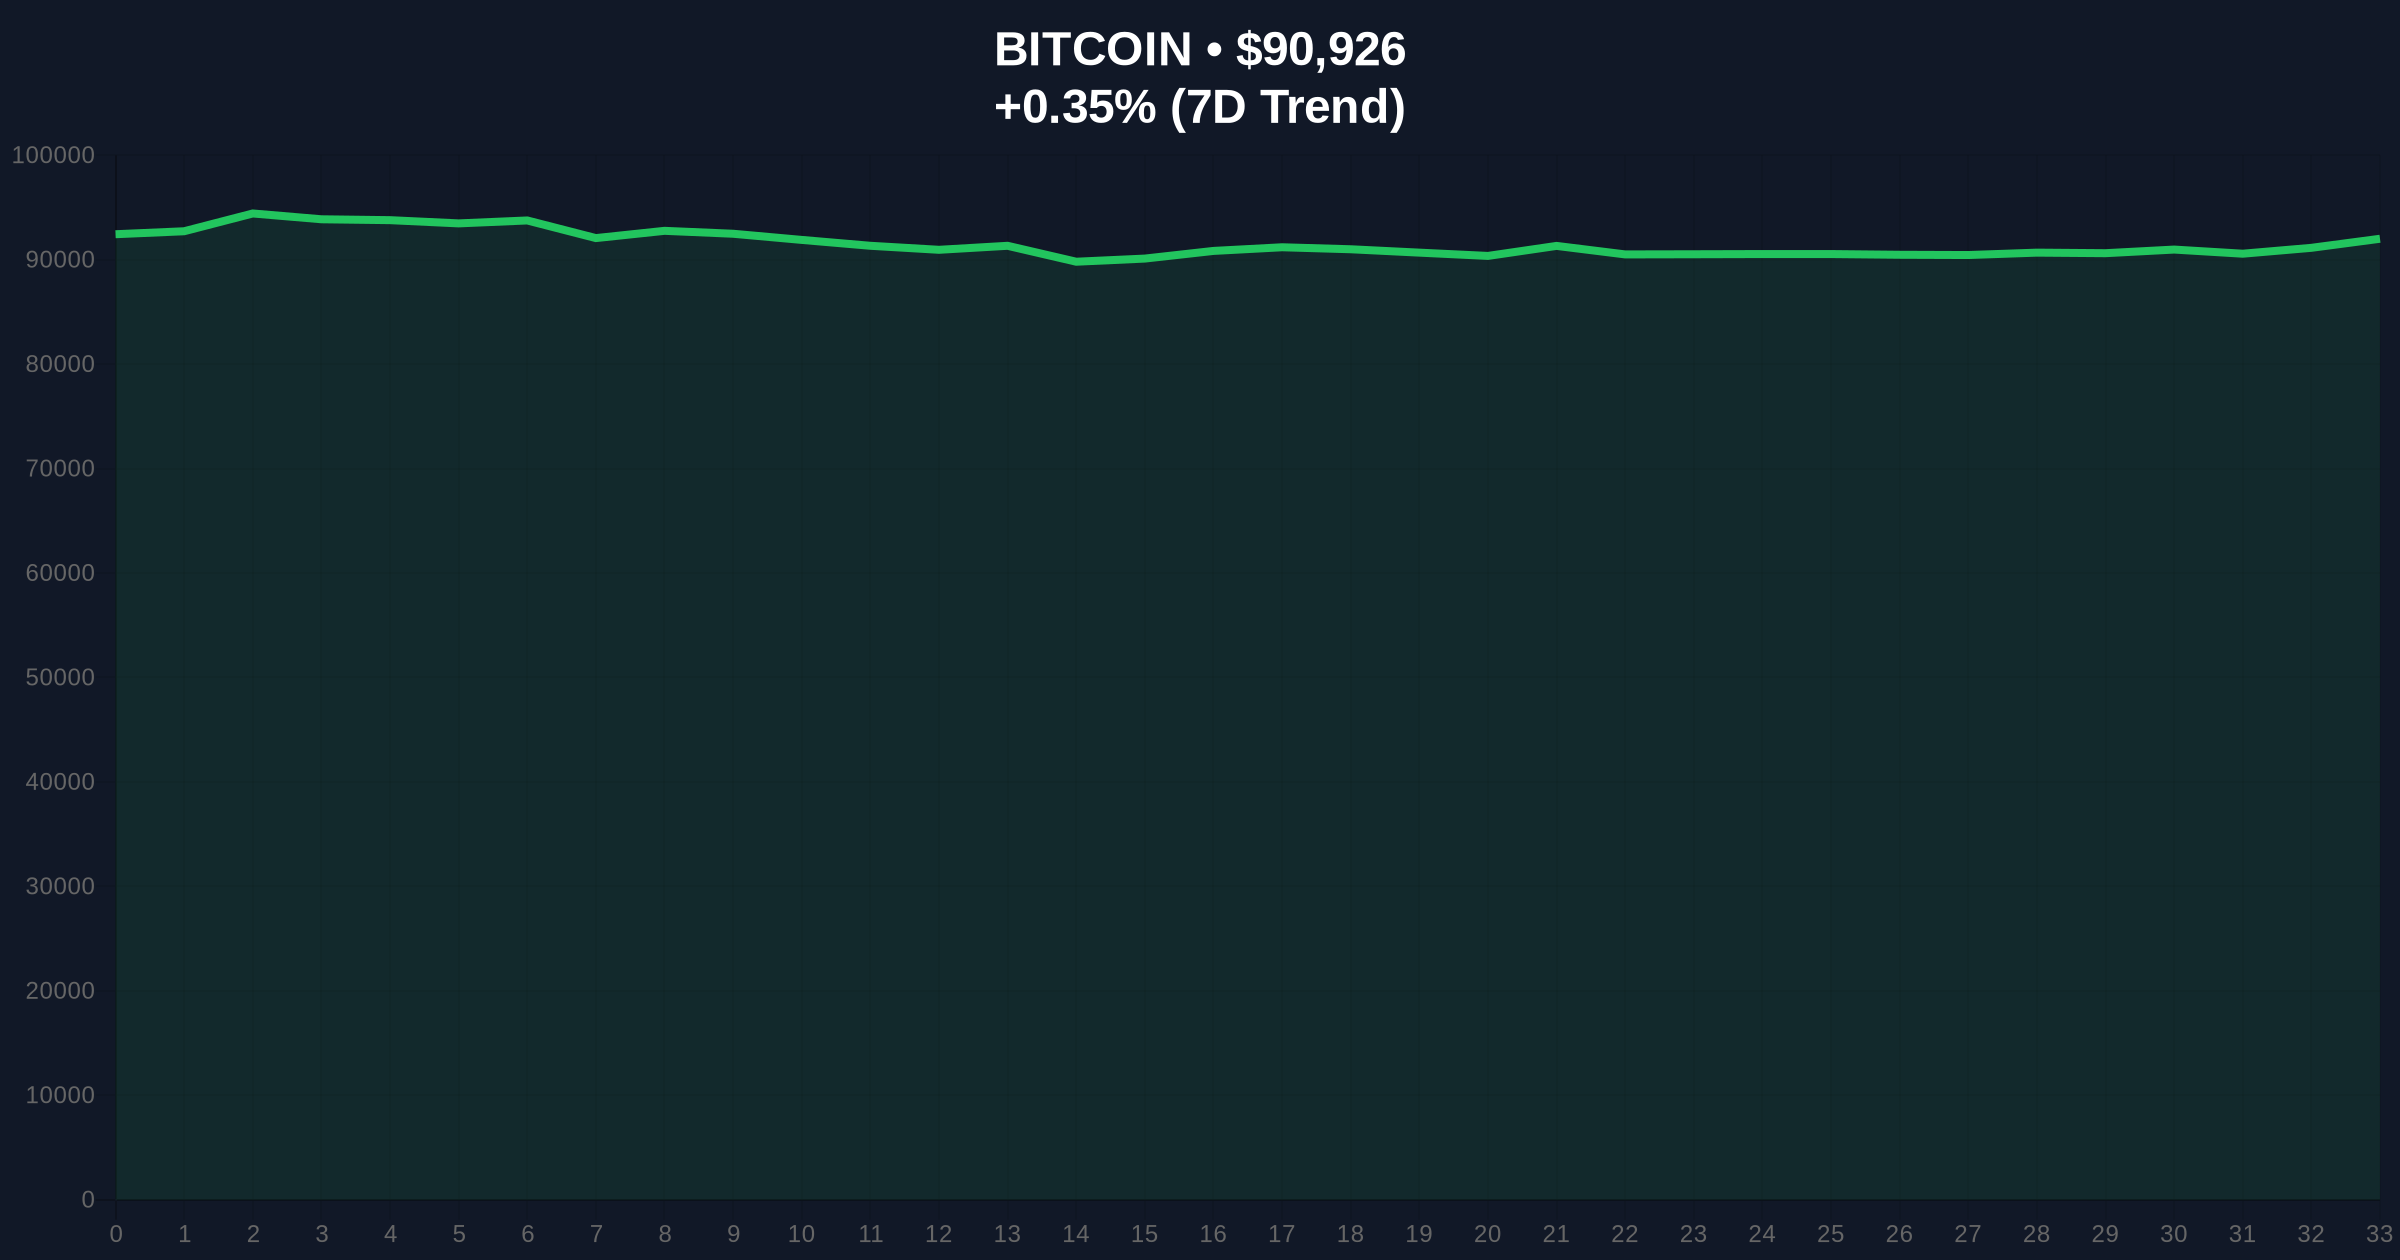
VADODARA, January 12, 2026 — According to CoinNess market monitoring, Bitcoin price action has broken below the $91,000 psychological threshold, trading at $90,997.44 on the Binance USDT market. This movement occurs against a backdrop of extreme market fear, with the Crypto Fear & Greed Index registering 27/100. Market structure suggests this is more than a routine correction; it represents a test of a critical liquidity zone that has held since the last major consolidation phase in Q4 2025.
This price action mirrors the December 2025 consolidation pattern where Bitcoin established a strong order block between $90,500 and $91,500. According to Glassnode liquidity maps, this zone accumulated significant volume during that period, creating what technical analysts term a Fair Value Gap (FVG). The current test of this FVG is critical because a failure to hold could trigger cascading liquidations in leveraged positions. Underlying this trend is a broader market narrative of strategic accumulation by institutional players, as evidenced by recent moves like the H100's Bitcoin asset manager acquisition, which signals long-term positioning despite short-term volatility.
On January 12, 2026, Bitcoin price action declined to $90,997.44, breaching the $91,000 support level that had served as a psychological barrier for the past two weeks. According to CoinNess data, this represents a 0.47% decline from previous levels, though the more significant metric is the breach itself. The move occurred during Asian trading hours, typically a period of lower liquidity, which amplified the price impact. Consequently, this has created a new bearish order block that must be invalidated for bullish momentum to resume.
Market structure suggests the immediate support zone lies between $90,500 and $90,800, corresponding with the 0.382 Fibonacci retracement level from the November 2025 rally. The Relative Strength Index (RSI) on the 4-hour chart is approaching oversold territory at 32, indicating potential for a short-term bounce. However, the 50-day moving average at $92,500 now acts as resistance, creating a compression zone. According to volume profile analysis, the $89,200 level represents the next major support, aligning with the 200-day moving average. Bullish invalidation occurs if price fails to reclaim $91,500 and breaks below $89,200, while bearish invalidation requires a sustained move above $93,000 to fill the current FVG.
| Metric | Value |
|---|---|
| Current Bitcoin Price | $91,062 |
| 24-Hour Change | +0.47% |
| Crypto Fear & Greed Index | 27/100 (Fear) |
| Market Rank | #1 |
| Key Support Level | $90,500 |
| Key Resistance Level | $92,500 |
For institutional investors, this price action tests the validity of the post-merge accumulation thesis that has driven Bitcoin's 5-year outlook. A break below $89,200 would invalidate the current bullish market structure and potentially trigger a gamma squeeze in options markets. For retail traders, the fear sentiment creates opportunities for contrarian accumulation, but requires precise risk management around the defined invalidation levels. The broader implication connects to macroeconomic factors; as outlined in the Federal Reserve's monetary policy documentation, interest rate decisions continue to influence digital asset correlations with traditional markets.
Market analysts on X/Twitter are divided. Bulls point to the strategic liquidity grabs by exchanges like Binance's recent stablecoin listings as evidence of preparation for volatility. Bears highlight the breakdown of key technical levels and warn of potential further downside if the $90,500 support fails. One quantitative analyst noted, "The volume profile shows weak hands exiting at $91k, but the UTXO age distribution suggests long-term holders remain steadfast."
Bullish Case: If Bitcoin reclaims $91,500 and holds above the 50-day moving average, the next target is $95,000, filling the current FVG. This scenario requires sustained buying pressure and a shift in the Fear & Greed Index toward neutral. Historical cycles suggest that fear periods often precede rallies when support zones hold.Bearish Case: A break below $89,200 invalidates the bullish structure and targets $85,000, corresponding with the 0.618 Fibonacci level. This would likely coincide with increased leverage liquidations and a prolonged fear period. The bearish scenario gains probability if the RSI fails to bounce from oversold conditions.
Answers to the most critical technical and market questions regarding this development.

Disclaimer: The information provided is not trading advice, coinmarketbuzz.com holds no liability for any investments made based on the information provided on this page. We strongly recommend independent research and/or consultation with a qualified professional before making any investment decisions.
coinmarketbuzz.com leverages advanced AI technology to analyze market data. All content is fact-checked and reviewed by our editorial team to ensure accuracy and neutrality.