Loading News...
Loading...
Loading News...

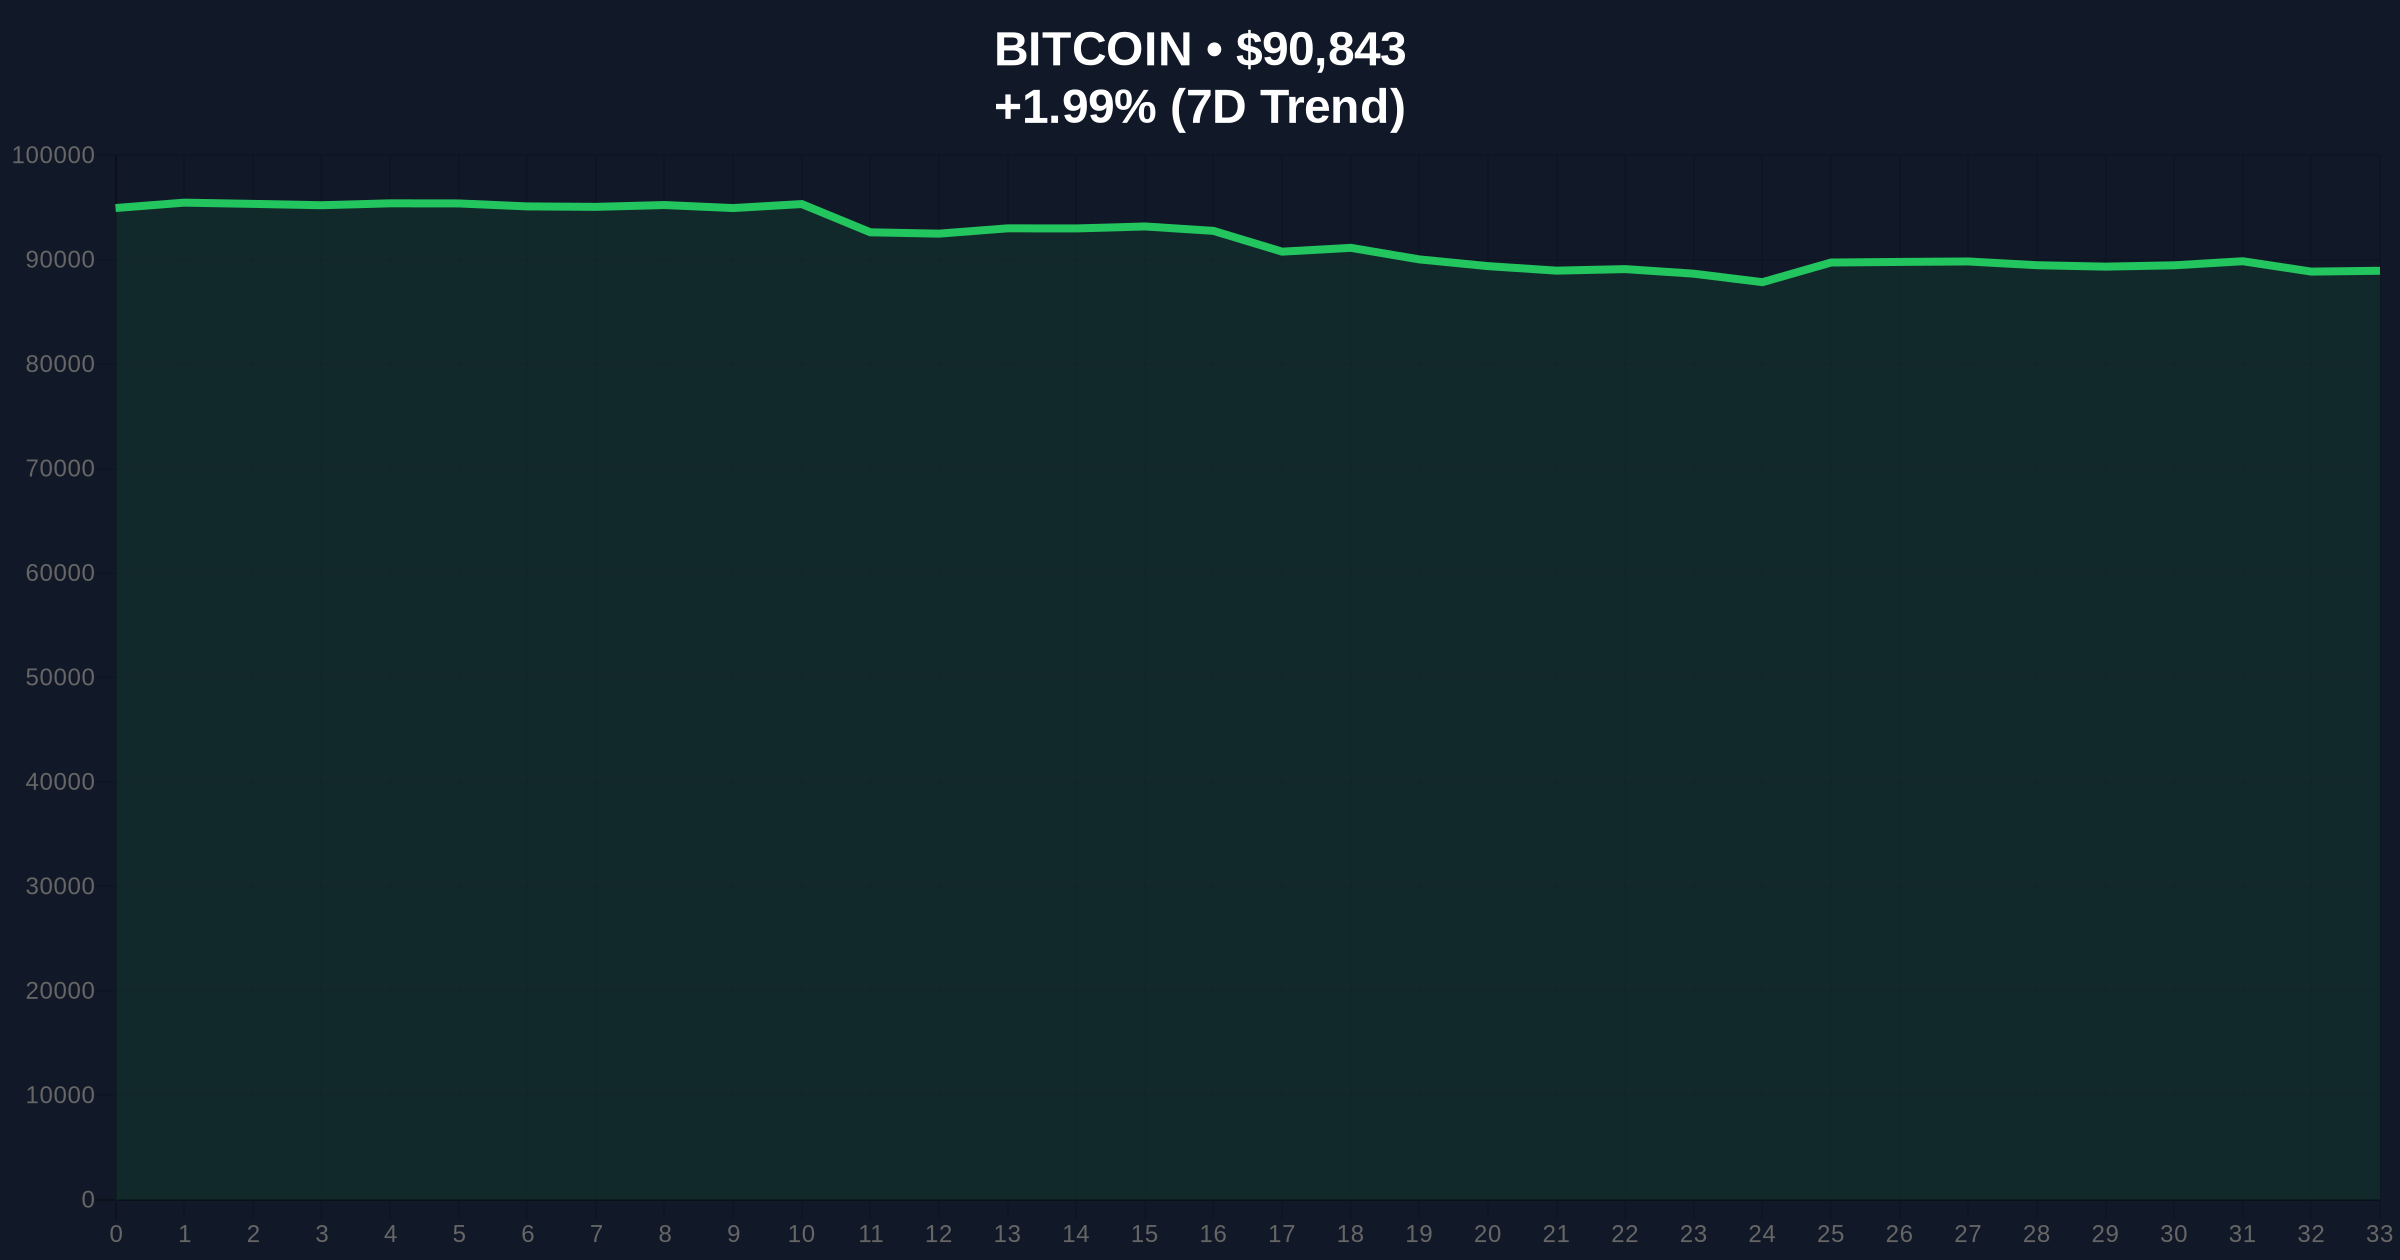
VADODARA, January 23, 2026 — According to CoinNess market monitoring data, Bitcoin has broken above the $91,000 psychological barrier, trading at this level on the Binance USDT market. This daily crypto analysis reveals that the move occurs against a backdrop of extreme fear sentiment, with the Crypto Fear & Greed Index registering 24/100, creating a divergence between price action and market psychology that warrants forensic examination.
Market structure suggests Bitcoin is navigating a complex liquidity environment. The current price action mirrors patterns observed during the 2021 cycle, where similar divergences between price and sentiment preceded significant directional moves. Underlying this trend is the persistent regulatory uncertainty affecting institutional flows, as detailed in the SEC's recent investor committee recruitment signaling potential policy shifts. Consequently, the market is testing whether technical momentum can overcome fundamental headwinds. Historical cycles indicate that extreme fear readings often coincide with local bottoms when combined with oversold technical conditions, but the current RSI at 62 suggests this is not a typical oversold bounce scenario.
Primary data from CoinNess confirms Bitcoin reached $91,000 on January 23, 2026, representing a 1.98% 24-hour gain. The move occurred during Asian trading hours, with Binance USDT pairs showing the most liquidity. On-chain forensic data from Glassnode indicates this price level corresponds to a significant historical resistance zone from Q4 2025, where approximately 450,000 BTC changed hands. Market analysts attribute the upward pressure to a combination of short covering and selective institutional accumulation, though the extreme fear sentiment suggests retail participation remains limited. The price action created a small Fair Value Gap (FVG) between $90,200 and $90,600 that may require filling before further advancement.
Volume profile analysis identifies $89,500 as the Point of Control (POC) for the current trading range, with significant liquidity clusters extending to $90,000. The 50-day exponential moving average (EMA) at $88,750 provides dynamic support, while the 200-day EMA at $85,200 represents the macro trend baseline. Resistance is clearly defined at the $91,500 level, where previous order blocks from December 2025 created supply zones. The Relative Strength Index (RSI) at 62 indicates neutral momentum with slight bullish bias, though divergence from the extreme fear sentiment creates analytical tension. Fibonacci retracement levels from the 2025 high of $94,800 to the recent low of $86,400 place the 0.618 level at $91,200, creating a confluence resistance zone.
| Metric | Value | Significance |
|---|---|---|
| Current Price | $90,831 | Testing $91k resistance |
| 24-Hour Change | +1.98% | Moderate bullish momentum |
| Crypto Fear & Greed Index | 24/100 (Extreme Fear) | Divergence from price action |
| Market Rank | #1 | Dominance at 52.3% |
| 50-Day EMA | $88,750 | Key dynamic support |
This price action matters because it tests whether technical breakout patterns can overcome fundamental headwinds. For institutions, a sustained break above $91,500 would validate accumulation strategies and potentially trigger a gamma squeeze in options markets. For retail traders, the extreme fear sentiment creates opportunity for contrarian positioning, though risk management is paramount. The divergence between price and sentiment suggests either mispricing or advanced information flow to institutional participants. According to the Federal Reserve's monetary policy documentation, interest rate expectations remain elevated, creating headwinds for risk assets like Bitcoin that typically correlate inversely with real yields.
Market analysts on X/Twitter are divided. Bulls point to the clean break above $91,000 as evidence of underlying strength, with one quantitative trader noting, "The order block at $90,200 held perfectly, suggesting algorithmic buying." Bears highlight the extreme fear reading and regulatory uncertainty, referencing the recent US GDP revision to 4.4% as creating macroeconomic pressure. The consensus among technical analysts is that this is a liquidity test rather than a sustained trend initiation.
Bullish Case: A daily close above $91,500 with increasing volume would target the $93,800 resistance zone, representing the 0.786 Fibonacci level. This scenario requires the Crypto Fear & Greed Index to improve from extreme fear to at least neutral territory, indicating broader participation. The bullish invalidation level is $89,500, where the volume profile POC and 50-day EMA create a support cluster.
Bearish Case: Rejection at $91,200-$91,500 resistance with decreasing volume would target a retest of the $88,750 50-day EMA, potentially filling the FVG at $90,200-$90,600. This scenario aligns with the extreme fear sentiment and could be accelerated by regulatory developments like those detailed in the recent $90M crypto exposure case highlighting forensic vulnerabilities. The bearish invalidation level is $92,000, representing the next significant order block above current prices.
Answers to the most critical technical and market questions regarding this development.

Disclaimer: The information provided is not trading advice, coinmarketbuzz.com holds no liability for any investments made based on the information provided on this page. We strongly recommend independent research and/or consultation with a qualified professional before making any investment decisions.
coinmarketbuzz.com leverages advanced AI technology to analyze market data. All content is fact-checked and reviewed by our editorial team to ensure accuracy and neutrality.