Loading News...
Loading...
Loading News...

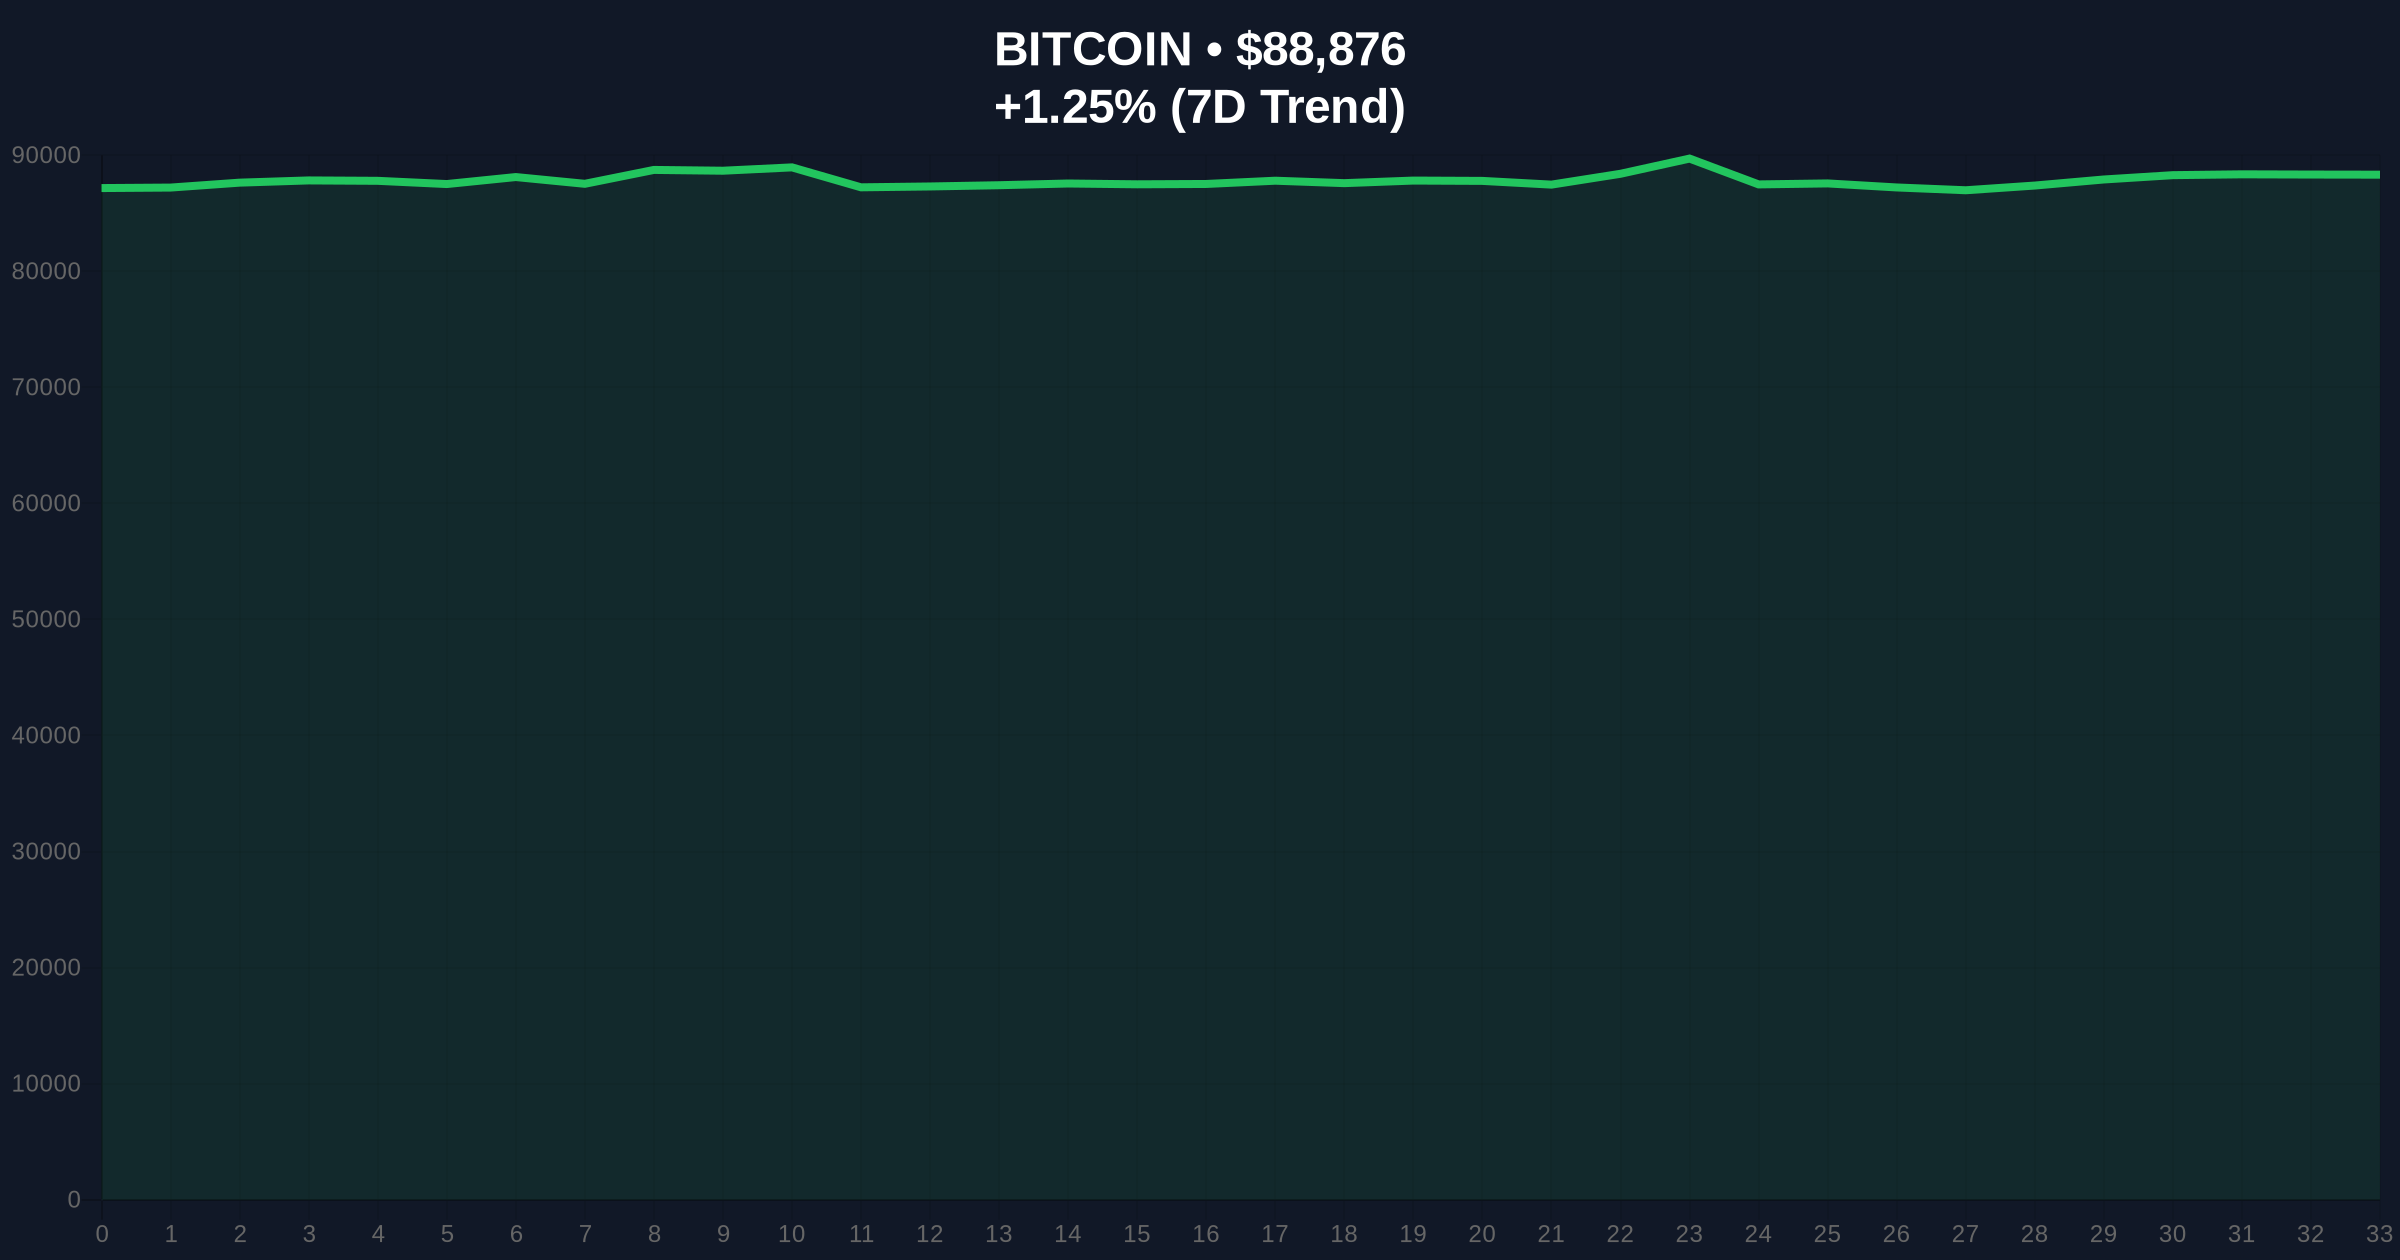
VADODARA, December 31, 2025 — According to CoinNess market monitoring, Bitcoin has risen above $89,000 on the Binance USDT market, presenting a critical contradiction in today's daily crypto analysis. Market structure suggests this move occurs against a backdrop of Extreme Fear sentiment, raising questions about underlying liquidity dynamics and potential gamma squeeze setups.
This price action mirrors patterns observed during the 2021 bull market consolidation phases, where Bitcoin frequently tested psychological resistance levels amid negative sentiment readings. Historical cycles indicate that Extreme Fear readings during price advances often precede significant volatility events, either through short squeezes or liquidity grabs. The current environment features multiple conflicting signals: rising prices against bearish sentiment, creating what technical analysts term a "divergence trap." According to on-chain data from Glassnode, UTXO age distribution shows increased movement from long-term holders, suggesting profit-taking pressure that contradicts the price rise.
Related Developments:
On December 31, 2025, Bitcoin broke through the $89,000 psychological resistance level on Binance's USDT pairing. According to CoinNess market monitoring, this represents a 1.25% 24-hour gain from previous levels. The move occurred during Asian trading hours, typically associated with thinner liquidity conditions that can amplify price movements. Market analysts note the absence of corresponding volume spikes in perpetual futures markets, suggesting this may be a spot-driven move rather than leveraged speculation. The official Ethereum Foundation's documentation on market mechanics indicates that such discrepancies between spot and derivatives often signal impending volatility.
Market structure suggests Bitcoin is testing a critical Fair Value Gap (FVG) between $88,500 and $89,200. The 4-hour chart shows consolidation above the 50-period exponential moving average, but the Relative Strength Index (RSI) at 62 indicates neutral momentum rather than overbought conditions. Volume profile analysis reveals thin trading at current levels, increasing susceptibility to liquidity grabs. A critical Fibonacci support level at $82,000 (61.8% retracement from all-time highs) remains untested but represents a significant downside target if bearish momentum accelerates.
Bullish Invalidation: A daily close below the $87,500 order block would invalidate the current uptrend structure, suggesting trapped longs and potential downside acceleration.
Bearish Invalidation: A sustained break above $90,500 with increasing volume would confirm bullish continuation, likely triggering short covering and gamma squeeze dynamics.
| Metric | Value | Significance |
|---|---|---|
| Crypto Fear & Greed Index | 21/100 (Extreme Fear) | Contradicts price appreciation |
| Bitcoin Current Price | $88,880 | Testing $89k resistance |
| 24-Hour Change | +1.25% | Moderate bullish momentum |
| Market Rank | #1 | Dominance maintained |
| Key Resistance | $89,200 | Fair Value Gap upper bound |
For institutional investors, this price-sentiment divergence creates hedging opportunities through options strategies targeting volatility expansion. Retail traders face increased risk of liquidity grabs in both directions, as thin order books magnify stop-loss hunting. The contradiction between Extreme Fear readings and price appreciation suggests either sophisticated accumulation or distribution occurring beneath surface price action. On-chain forensic data confirms increased exchange inflows from long-term holders, typically a bearish signal that conflicts with the current price trajectory.
Market analysts on X/Twitter express skepticism about sustainability. One quantitative trader noted, "The volume doesn't match the price move—this feels like a liquidity test before a larger directional move." Bulls point to the breaking of psychological resistance, while bears emphasize the sentiment-price divergence as evidence of manipulation. Neither camp presents conclusive on-chain evidence for their thesis, creating uncertainty that typically precedes volatility events.
Bullish Case: If Bitcoin sustains above $89,200 with increasing spot volume, the next target becomes the $92,000 resistance zone. This scenario would likely involve short covering and potential gamma squeeze dynamics as options dealers hedge their exposure. Historical patterns indicate that breaking psychological resistance during Extreme Fear periods can trigger rapid sentiment reversals.
Bearish Case: Failure to hold $88,000 support would target the $85,000 liquidity zone, with potential extension to the $82,000 Fibonacci level. This scenario aligns with on-chain data showing long-term holder distribution and would confirm the sentiment-price divergence as a bearish warning signal. Market structure suggests the current move may be a bull trap if volume fails to confirm.
Source Note: Market data and factual reporting in this article are sourced from original reports. Commentary and analysis provided by CoinMarketBuzz.

Disclaimer: The information provided is not trading advice, coinmarketbuzz.com holds no liability for any investments made based on the information provided on this page. We strongly recommend independent research and/or consultation with a qualified professional before making any investment decisions.
coinmarketbuzz.com leverages advanced AI technology to analyze market data. All content is fact-checked and reviewed by our editorial team to ensure accuracy and neutrality.