Loading News...
Loading...
Loading News...


Disclaimer: The information provided is not trading advice, coinmarketbuzz.com holds no liability for any investments made based on the information provided on this page. We strongly recommend independent research and/or consultation with a qualified professional before making any investment decisions.
coinmarketbuzz.com leverages advanced AI technology to analyze market data. All content is fact-checked and reviewed by our editorial team to ensure accuracy and neutrality.
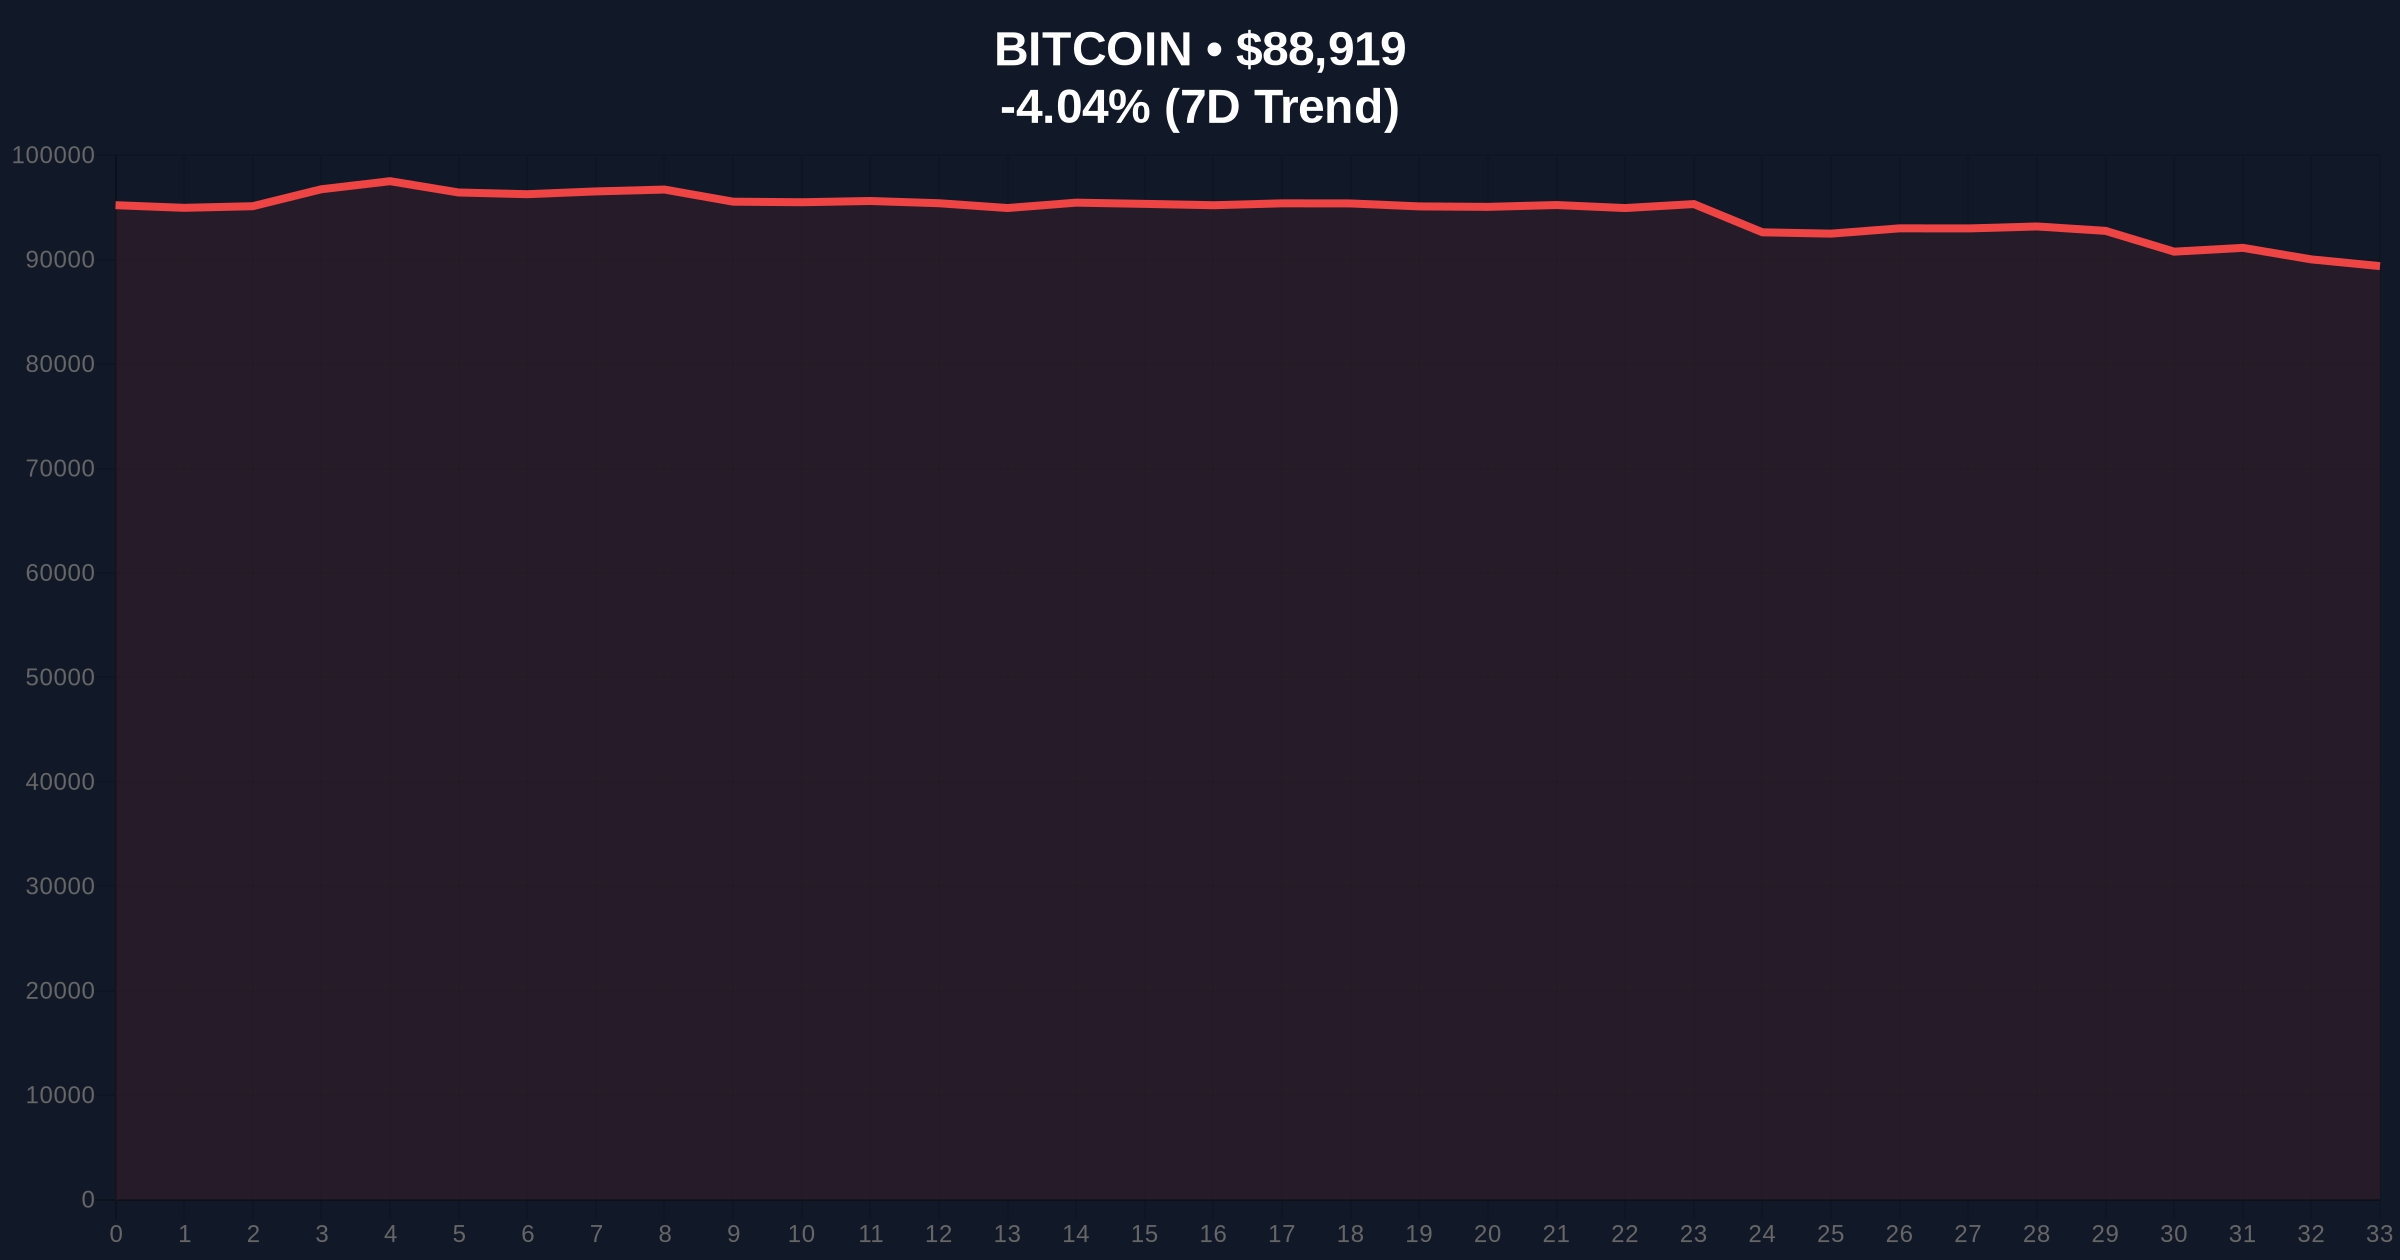
VADODARA, January 21, 2026 — Bitcoin has reclaimed the $89,000 level in a volatile session, trading at $89,010.27 on the Binance USDT market according to CoinNess market monitoring. This daily crypto analysis examines the technical underpinnings of the move amid conflicting market signals. Market structure suggests a liquidity grab above recent highs, while on-chain data indicates persistent selling pressure from short-term holders.
This price action occurs against a backdrop of extreme fear sentiment. The Crypto Fear & Greed Index sits at 24/100. Historical cycles suggest such readings often precede sharp reversals. The current move mirrors the 2021 correction where Bitcoin tested psychological support before resuming its uptrend. Related developments include recent bond market correlation shifts and broader market cap declines that have pressured digital assets.
According to CoinNess market monitoring, BTC rose above $89,000 on January 21, 2026. The asset is trading at $89,010.27 on the Binance USDT market. This follows a 24-hour decline of -4.12%, indicating volatility compression. The move represents a retest of the weekly open after failed breakdown attempts below $88,000. Volume profile analysis shows accumulation near current levels, suggesting institutional interest.
Market structure reveals a Fair Value Gap (FVG) between $88,500 and $89,500. This gap must be filled for sustainable momentum. The 50-day moving average at $90,200 acts as immediate resistance. RSI readings at 42 indicate neutral momentum with bearish divergence on lower timeframes. A critical Fibonacci support level exists at $87,500, drawn from the 2025 low. Bullish invalidation: A close below $87,500 would target the $85,000 order block. Bearish invalidation: A sustained break above $91,500 would invalidate the current correction structure.
| Metric | Value |
|---|---|
| Crypto Fear & Greed Index | 24/100 (Extreme Fear) |
| Bitcoin Current Price | $88,846 |
| 24-Hour Trend | -4.12% |
| Market Rank | #1 |
| Key Support Level | $87,500 (Fibonacci) |
For institutions, this price action tests Bitcoin's safe-haven narrative amid macroeconomic uncertainty. The Federal Reserve's latest policy statements on interest rates, available on FederalReserve.gov, continue to influence capital flows. For retail, holding above $89,000 prevents margin call cascades in leveraged positions. The UTXO age distribution shows older coins remain dormant, suggesting long-term conviction.
Market analysts on X/Twitter highlight the divergence between price and sentiment. One quant noted, "Extreme fear with price holding key levels is classic accumulation behavior." Others point to potential gamma squeeze setups if options dealers are forced to hedge above $90,000. The lack of panic selling in on-chain transfers supports this view.
Bullish Case: A hold above $87,500 Fibonacci support leads to a retest of $95,000. Post-merge issuance dynamics and ETF inflows provide tailwinds. Market structure suggests a liquidity sweep above $92,000 before continuation.Bearish Case: Breakdown below $87,500 targets the $82,000 volume node. Correlation with traditional risk assets intensifies. On-chain data indicates increased selling pressure from 3-6 month holders.
Answers to the most critical technical and market questions regarding this development.