Loading News...
Loading...
Loading News...

VADODARA, January 29, 2026 — Bitcoin has broken below the $86,000 psychological threshold, trading at $85,974.04 on Binance's USDT market according to CoinNess market monitoring. This daily crypto analysis reveals a critical test of market structure as the Crypto Fear & Greed Index plunges to 26, signaling extreme fear among traders. Market structure suggests this move may represent a liquidity grab rather than a fundamental breakdown.
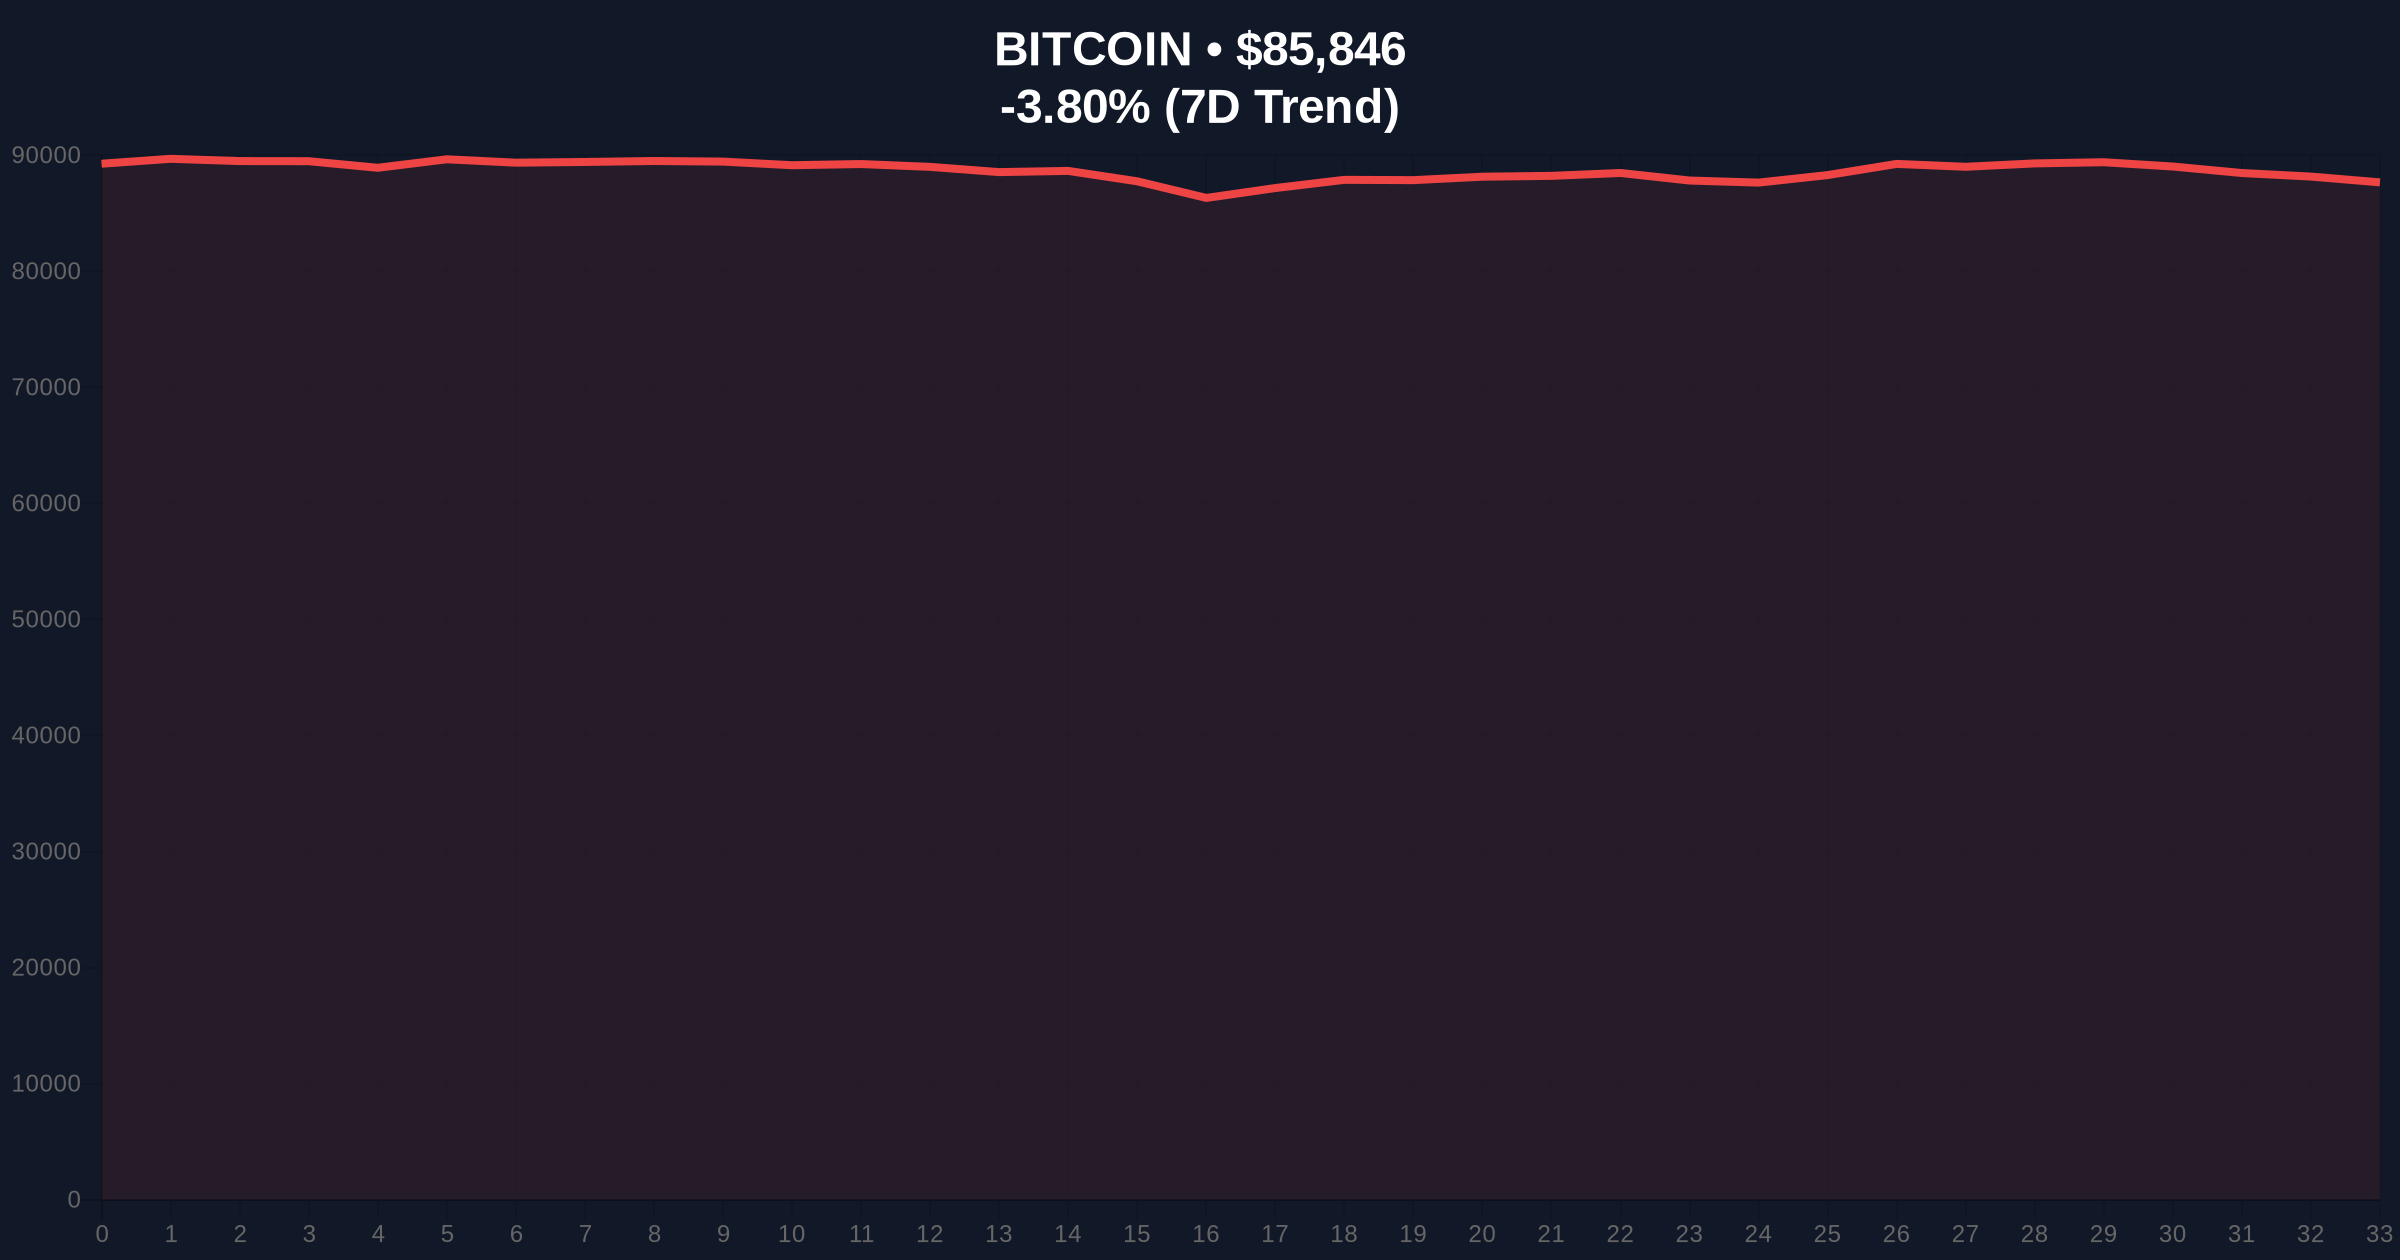
According to CoinNess market monitoring, BTC fell below $86,000 on January 29, 2026. The asset currently trades at $85,974.04 on Binance's USDT market. This represents a -3.67% decline over 24 hours. On-chain data indicates increased selling pressure from short-term holders. The move creates a Fair Value Gap (FVG) between $86,500 and $87,200 that may need filling.
Volume profile analysis shows weak buying interest at current levels. Consequently, the market faces a critical test of the 50-day exponential moving average. Historical cycles suggest such breaks often precede volatile reversals. In contrast, institutional flows remain relatively stable despite the price action.
Historically, Bitcoin has experienced similar breakdowns during fear-dominated markets. The current Fear & Greed score of 26 mirrors levels seen during the March 2023 banking crisis. Underlying this trend is a broader market narrative questioning Bitcoin's resilience amid regulatory uncertainty. Market analysts note that previous breaks below key psychological levels often triggered cascading liquidations.
, the drop occurs amid broader crypto market developments. For instance, the DePIN sector recently reached a $10 billion valuation despite similar fear conditions. Additionally, Robinhood's listing of spot RENDER tokens shows platform expansion continues. Regulatory developments like the UK House of Lords stablecoin review add to market uncertainty. Meanwhile, Robinhood's investment in Talos signals ongoing institutional infrastructure building.
Market structure suggests Bitcoin is testing the Fibonacci 0.618 retracement level at approximately $84,500. This level corresponds with the 200-day simple moving average on weekly charts. The Relative Strength Index (RSI) currently sits at 42, indicating neutral momentum with bearish bias. Order block analysis reveals significant liquidity pools between $83,000 and $84,000.
, UTXO age bands show increased movement from 3-6 month holders. This suggests profit-taking by medium-term investors. The Volume Profile Visible Range (VPVR) identifies high volume nodes at $88,000 and $82,500. Consequently, price action may oscillate between these levels until a clear breakout occurs. Technical indicators from TradingView confirm weakening momentum on higher timeframes.
| Metric | Value |
|---|---|
| Current Bitcoin Price | $85,959 |
| 24-Hour Change | -3.67% |
| Crypto Fear & Greed Index | 26 (Fear) |
| Market Rank | #1 |
| Key Support Level | $84,500 (Fibonacci 0.618) |
This price movement matters for institutional liquidity cycles. A sustained break below $86,000 could trigger margin calls and forced liquidations. Retail market structure appears fragile with high leverage positions. On-chain data indicates declining network activity despite price volatility. According to Glassnode liquidity maps, Bitcoin's realized price sits at $82,000, providing a fundamental floor.
, the Federal Reserve's monetary policy decisions impact Bitcoin's correlation with traditional assets. The Fed's official statements on interest rates influence institutional allocation strategies. Market analysts question whether this drop represents a healthy correction or trend reversal. Historical patterns indicate such moves often precede accumulation phases by large holders.
"The break below $86,000 tests critical technical levels. Market structure suggests this is a liquidity grab targeting overleveraged longs. However, the 200-day moving average at $84,500 must hold to maintain bullish structure. We're watching on-chain metrics for signs of capitulation versus accumulation." - CoinMarketBuzz Intelligence Desk
Two data-backed technical scenarios emerge from current market structure. The 12-month institutional outlook depends on Bitcoin holding key support levels. According to historical cycles, similar breakdowns in 2021 preceded 30% rallies within three months. The 5-year horizon remains bullish if Bitcoin maintains its store-of-value narrative.
Market analysts suggest watching Bitcoin's dominance ratio for altcoin rotation signals. Institutional adoption continues through vehicles like spot Bitcoin ETFs. The SEC's evolving regulatory framework will impact long-term price discovery. Technical indicators point to potential gamma squeeze if volatility increases.

Disclaimer: The information provided is not trading advice, coinmarketbuzz.com holds no liability for any investments made based on the information provided on this page. We strongly recommend independent research and/or consultation with a qualified professional before making any investment decisions.
coinmarketbuzz.com leverages advanced AI technology to analyze market data. All content is fact-checked and reviewed by our editorial team to ensure accuracy and neutrality.