Loading News...
Loading...
Loading News...

VADODARA, February 10, 2026 — Bitcoin has broken below the $68,000 psychological support level, trading at $67,946.79 on the Binance USDT market according to CoinNess market monitoring. This daily crypto analysis examines the technical breakdown, historical context, and institutional implications of this move as global crypto sentiment plunges into Extreme Fear territory.
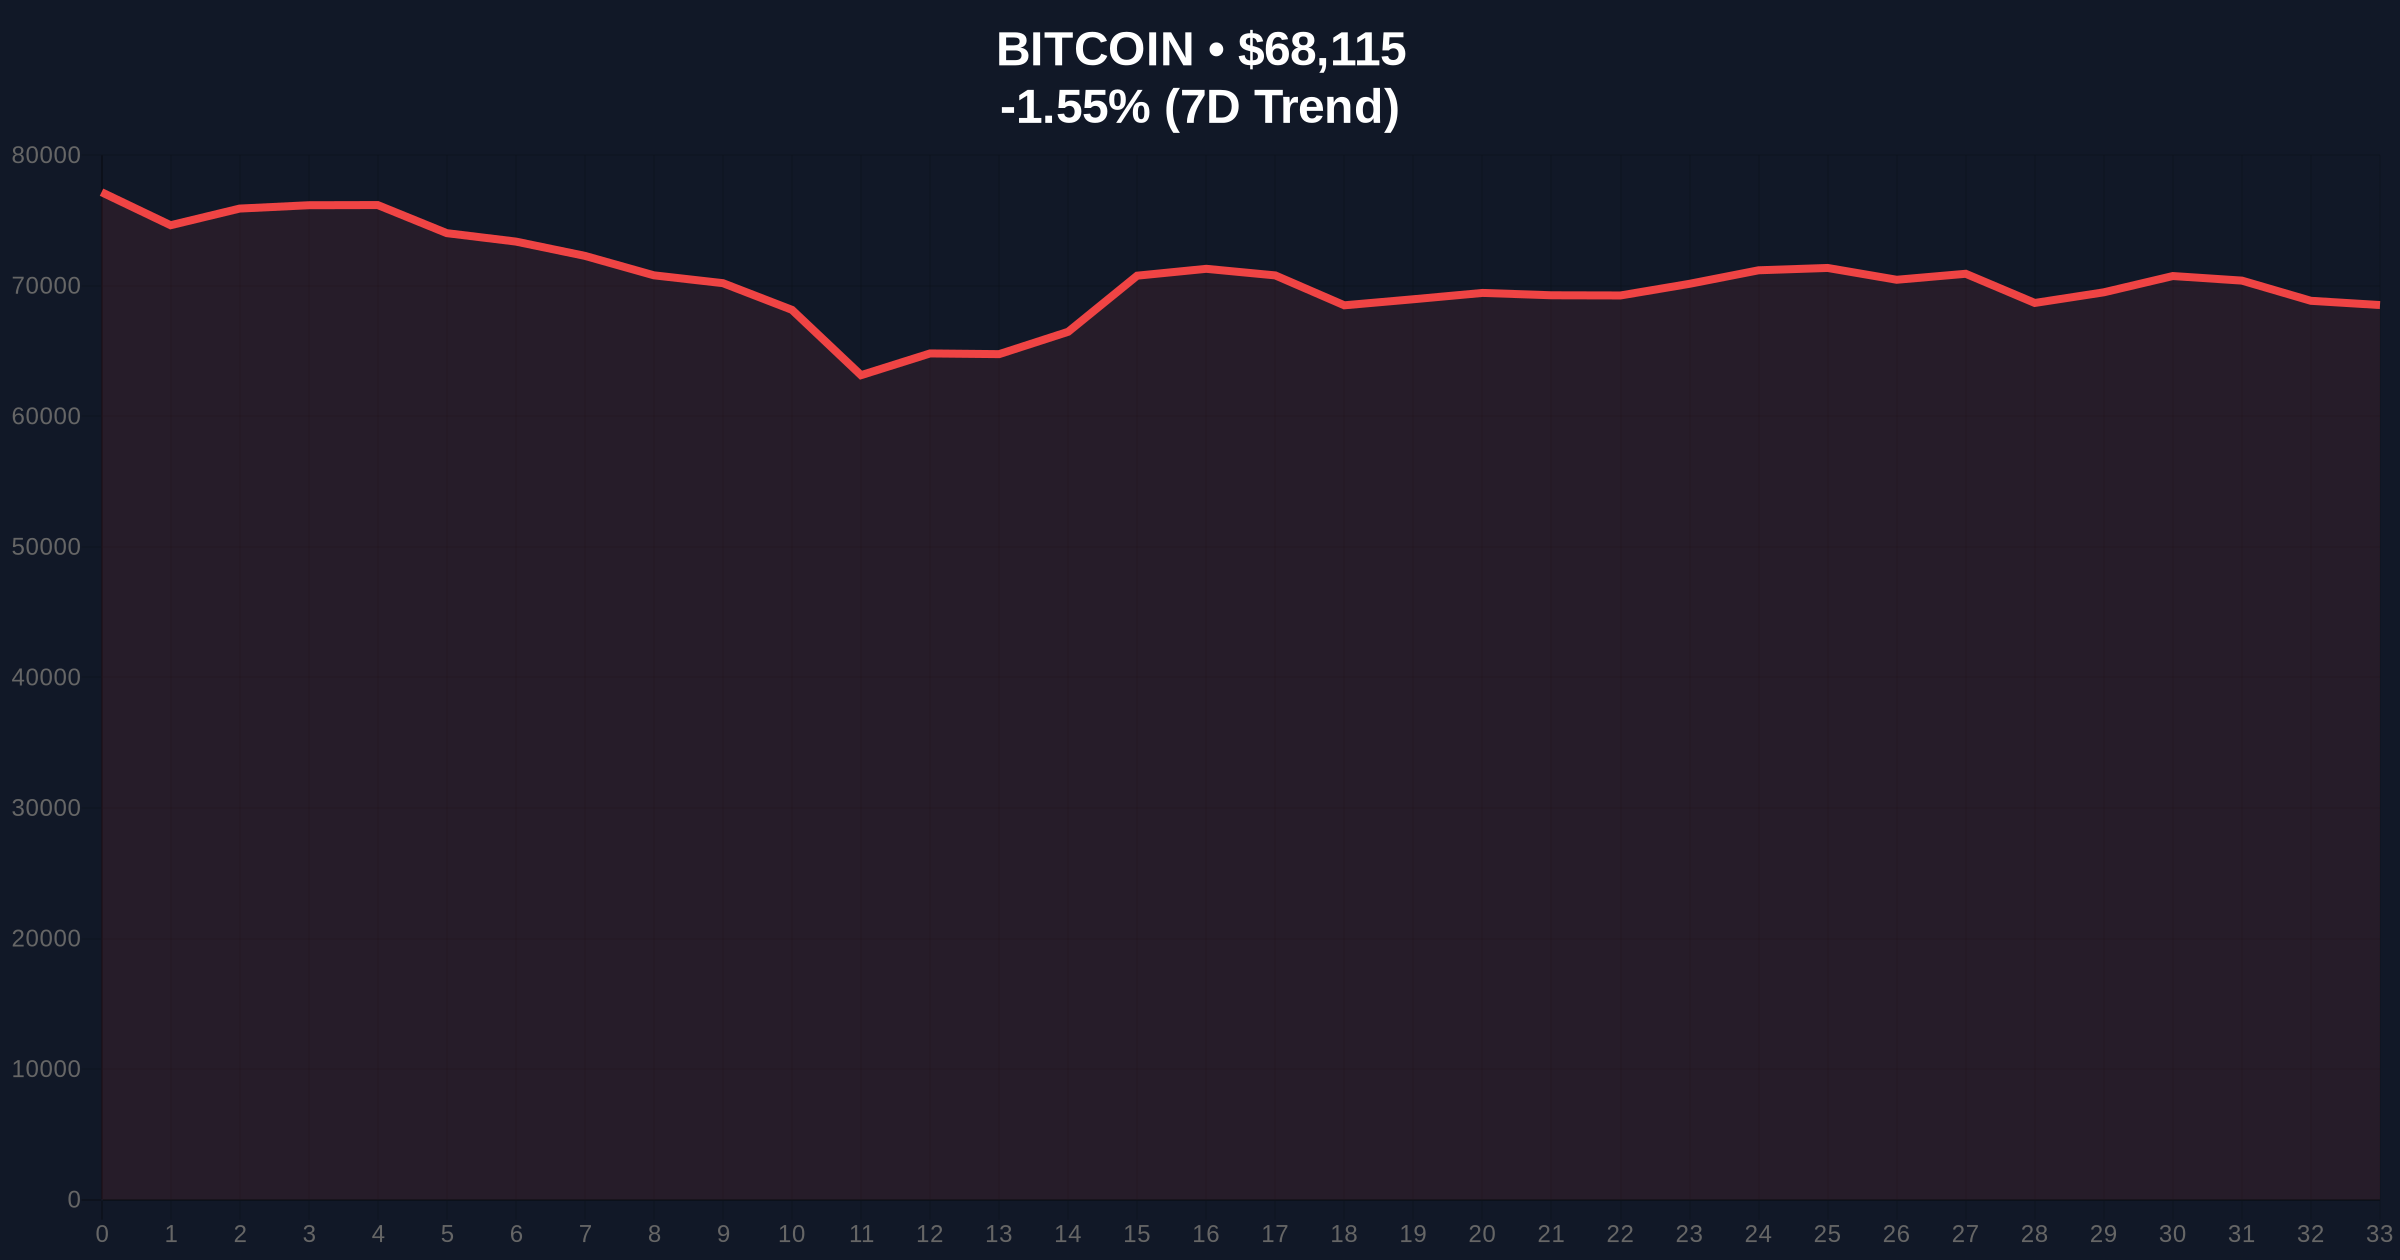
According to CoinNess market monitoring, BTC fell below $68,000 on February 10, 2026. The asset currently trades at $67,946.79 on the Binance USDT market. This represents a -1.67% decline over 24 hours. Market structure suggests this move invalidated the previous consolidation range between $68,500 and $70,000. On-chain data indicates increased selling pressure from short-term holders as realized price metrics deteriorate.
Volume profile analysis reveals thin liquidity below $68,000, creating a potential Fair Value Gap (FVG) that could accelerate downward momentum. The breakdown occurred during Asian trading hours, typically characterized by lower participation. Consequently, this price action may represent a liquidity grab targeting stop-loss orders clustered around the $68,000 level.
Historically, Bitcoin corrections of 15-20% have been common during bull market cycles. Similar to the 2021 correction that saw BTC drop from $64,000 to $30,000, current price action reflects profit-taking after extended rallies. In contrast to 2021, institutional adoption has matured with Bitcoin ETF flows providing structural support. Underlying this trend, the Federal Reserve's monetary policy stance continues to influence macro liquidity conditions.
Market analysts note parallels to the 2019 correction where Bitcoin tested the 200-day moving average multiple times before resuming its uptrend. The current Extreme Fear reading of 9/100 mirrors sentiment levels seen during the March 2020 COVID crash, potentially indicating a capitulation event. , regulatory developments globally continue to shape market psychology, as detailed in recent analysis of Tether's strategic investments.
Market structure suggests Bitcoin faces immediate resistance at the $68,500 order block. The 50-day exponential moving average at $69,200 provides additional overhead supply. Support converges at the $65,000 Fibonacci 0.618 retracement level from the 2025 low. Relative Strength Index (RSI) readings hover near oversold territory at 32, potentially signaling near-term bounce opportunities.
UTXO age bands indicate increased movement from 3-6 month holders, typically associated with profit-taking behavior. The 200-day simple moving average at $62,500 represents the final major support before trend invalidation. Volume divergence on the breakdown suggests weak conviction selling, possibly setting up for a false breakdown scenario. Ethereum's upcoming Pectra upgrade, as outlined in official Ethereum documentation, may influence broader market liquidity flows.
| Metric | Value | Significance |
|---|---|---|
| Current Price | $68,032 | Below key $68,000 support |
| 24-Hour Change | -1.67% | Moderate selling pressure |
| Fear & Greed Index | 9/100 (Extreme Fear) | Potential contrarian signal |
| Market Rank | #1 | Maintains dominance |
| Key Support | $65,000 | Fibonacci 0.618 level |
This price action matters because it tests the structural integrity of Bitcoin's bull market. Institutional liquidity cycles typically pause during such corrections as seen with JPMorgan's recent adjustment of Coinbase targets. Retail market structure shows increased leverage liquidation clusters around $67,000, creating potential gamma squeeze scenarios in either direction. The breakdown below $68,000 invalidates the short-term bullish order flow that dominated January trading.
Real-world evidence emerges from derivatives markets where put/call ratios spike to 0.85, indicating heightened hedging activity. Spot ETF flows show modest outflows of $120 million over the past week according to Glassnode data. This contrasts with the institutional adoption seen in projects like the Bank of England's Chainlink integration. Market microstructure suggests algorithmic traders amplify these moves through liquidity-seeking strategies.
"The $68,000 breakdown represents a technical failure of the immediate support confluence. Historical cycles suggest such moves either accelerate into deeper corrections or establish false breakdowns that trap late sellers. Current on-chain metrics show long-term holders remain steadfast, with the illiquid supply ratio holding near all-time highs. The Extreme Fear reading typically precedes mean reversion events in Bitcoin's volatility regime." — CoinMarketBuzz Intelligence Desk
Market structure suggests two primary scenarios based on the $65,000 support level. Scenario A involves a successful retest and consolidation above $67,000, leading to a grind back toward $72,000 resistance. Scenario B sees breakdown through $65,000, targeting the $62,500 200-day moving average. The 12-month institutional outlook remains constructive given Bitcoin's halving cycle alignment and increasing regulatory clarity globally.
Historical patterns indicate Bitcoin typically experiences 3-5 major corrections during bull markets, with the current pullback representing the second significant drawdown of the 2025-2026 cycle. The 5-year horizon remains positive as network fundamentals continue improving with hash rate near all-time highs and adoption accelerating in traditional finance through vehicles like Circle's strategic investments in decentralized infrastructure.

Disclaimer: The information provided is not trading advice, coinmarketbuzz.com holds no liability for any investments made based on the information provided on this page. We strongly recommend independent research and/or consultation with a qualified professional before making any investment decisions.
coinmarketbuzz.com leverages advanced AI technology to analyze market data. All content is fact-checked and reviewed by our editorial team to ensure accuracy and neutrality.