Loading News...
Loading...
Loading News...

VADODARA, February 2, 2026 — Bitcoin price action has decisively broken below the $75,000 psychological support level, trading at $74,931.44 on the Binance USDT market according to CoinNess market monitoring. This move occurs against a backdrop of Extreme Fear sentiment, with the Crypto Fear & Greed Index hitting a score of 14/100. Market structure suggests this is more than a routine correction; it represents a critical test of institutional conviction and technical integrity.
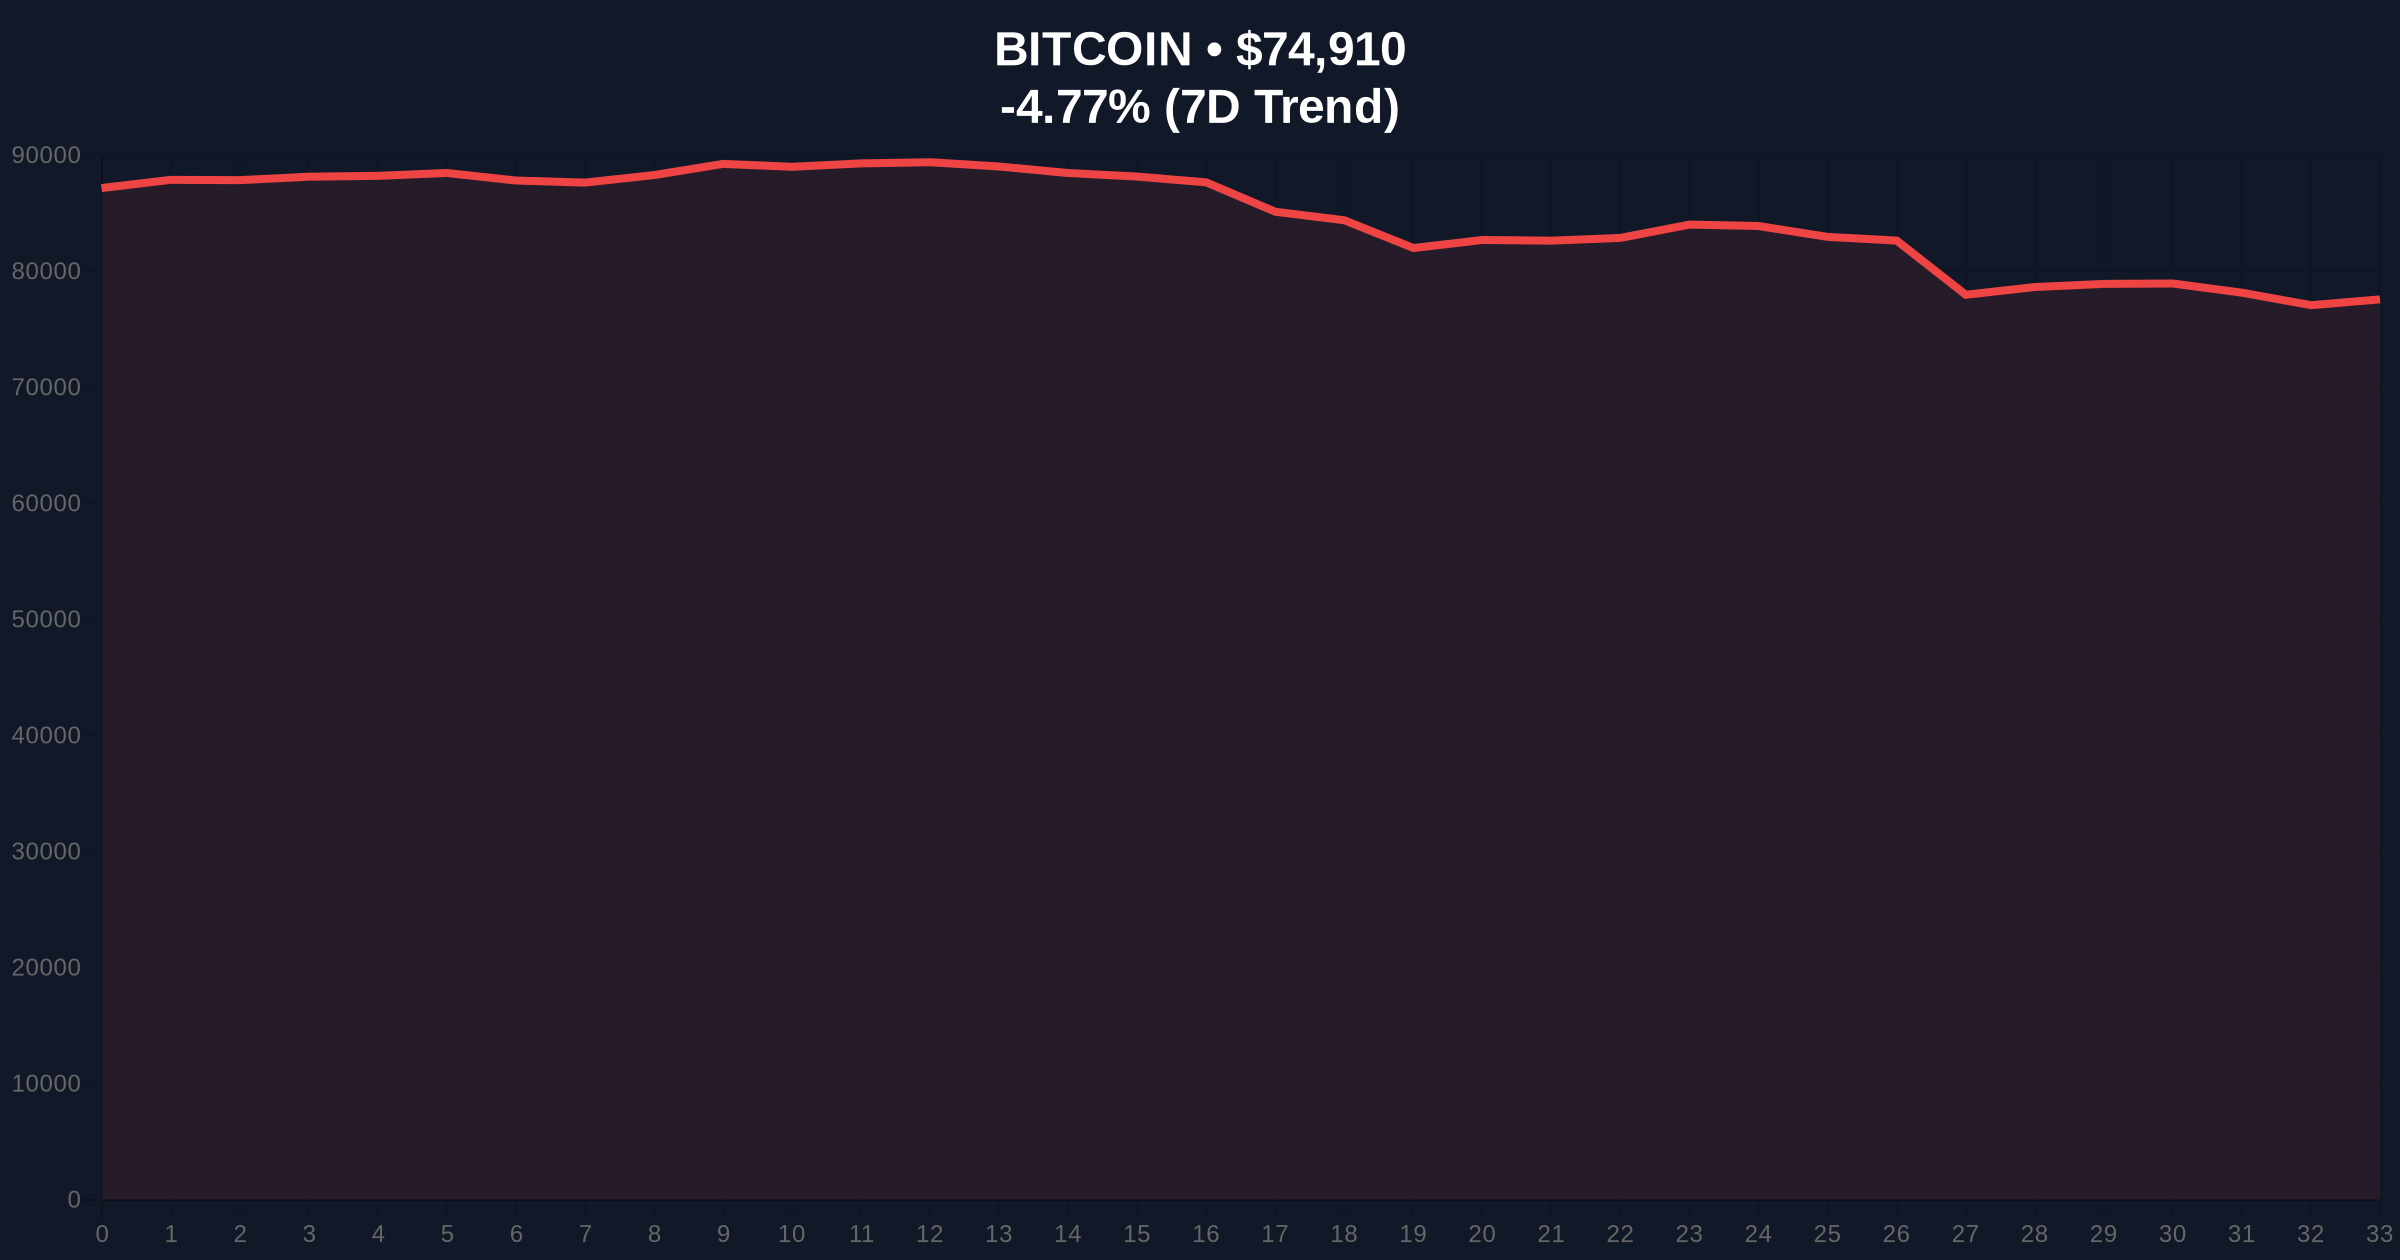
According to CoinNess market monitoring, BTC fell below $75,000 on February 2, 2026. The asset traded at $74,931.44 on the Binance USDT market at the time of reporting. This price action represents a -4.61% decline over 24 hours. Market analysts attribute the move to a combination of leveraged long liquidations and a broader risk-off sentiment. The breakdown invalidated a key weekly order block that had previously acted as support, creating a new Fair Value Gap (FVG) between $75,500 and $76,200.
Historically, Bitcoin has experienced similar breakdowns during periods of Extreme Fear. For instance, the 2021 cycle saw a -50% correction from all-time highs before resuming its bull trend. In contrast, the current decline appears more contained but structurally significant. Underlying this trend is a surge in futures liquidations, with recent data showing $369 million in crypto futures liquidations as longs dominate. This pattern mirrors the liquidity grab mechanics observed in previous bear market rallies.
, regulatory developments are adding pressure. South Korea's Financial Supervisory Service (FSS) recently deployed an AI platform called VISTA to target crypto market manipulation, increasing surveillance and potential selling pressure from compliant entities. Additionally, large institutional positions face stress, such as Trend Research's $1.43 billion ETH position facing a $1,830 liquidation level amid the extreme fear environment.
Market structure suggests Bitcoin is testing the $73,200 Fibonacci 0.618 retracement level from its recent swing high. This level coincides with a high-volume node on the Volume Profile, indicating strong historical support. The Relative Strength Index (RSI) on the daily chart sits at 38, approaching oversold territory but not yet extreme. The 50-day moving average at $78,500 now acts as dynamic resistance. A break below the $73,200 level would invalidate the current bullish higher-low structure and potentially target the $70,000 psychological zone.
On-chain data from Glassnode indicates a decrease in Bitcoin held on exchanges, suggesting some accumulation during dips. However, the Net Unrealized Profit/Loss (NUPL) metric remains in the "Belief-Denial" phase, indicating that many holders are still in profit but becoming anxious. This creates a potential supply overhang if fear intensifies.
| Metric | Value | Interpretation |
|---|---|---|
| Current BTC Price | $75,036 | Below key $75k support |
| 24-Hour Change | -4.61% | Significant sell pressure |
| Crypto Fear & Greed Index | 14/100 (Extreme Fear) | Contrarian buy signal historically |
| Market Rank | #1 | Dominance remains intact |
| Key Fibonacci Support | $73,200 | 0.618 retracement level |
This breakdown matters because $75,000 was a critical psychological and technical level. Institutional investors often use round numbers as liquidity benchmarks. A sustained break below could trigger stop-loss orders and margin calls, exacerbating the decline. , the Extreme Fear sentiment, while potentially a contrarian indicator, also reflects real panic that can lead to irrational selling. The Ethereum network's upcoming Pectra upgrade, which includes EIP-7702, could divert attention and capital from Bitcoin if the decline persists, affecting overall market structure.
"The break below $75,000 is technically significant but not yet catastrophic. Market structure suggests we are in a re-accumulation phase after the recent rally. However, if the $73,200 Fibonacci support fails, we could see a rapid move to test the $70,000 zone. The Extreme Fear reading is interesting—historically, such levels have marked intermediate bottoms, but they can also precede capitulation events."
Based on current market structure, two primary scenarios emerge:
Over the next 12 months, institutional outlook remains cautiously optimistic. Historical cycles suggest that corrections of 20-30% are common in bull markets. However, regulatory headwinds and macroeconomic factors, such as potential Federal Reserve policy shifts, could extend the consolidation phase. The 5-year horizon still favors Bitcoin as a store of value, but short-term volatility is expected to remain elevated.

Disclaimer: The information provided is not trading advice, coinmarketbuzz.com holds no liability for any investments made based on the information provided on this page. We strongly recommend independent research and/or consultation with a qualified professional before making any investment decisions.
coinmarketbuzz.com leverages advanced AI technology to analyze market data. All content is fact-checked and reviewed by our editorial team to ensure accuracy and neutrality.