Loading News...
Loading...
Loading News...

VADODARA, February 7, 2026 — Bitcoin has decisively broken below the psychological $70,000 level, trading at $69,998.01 on the Binance USDT market according to CoinNess market monitoring. This daily crypto analysis examines whether this move represents a structural breakdown or a temporary liquidity flush. Market structure suggests a critical test of institutional bid walls is underway.
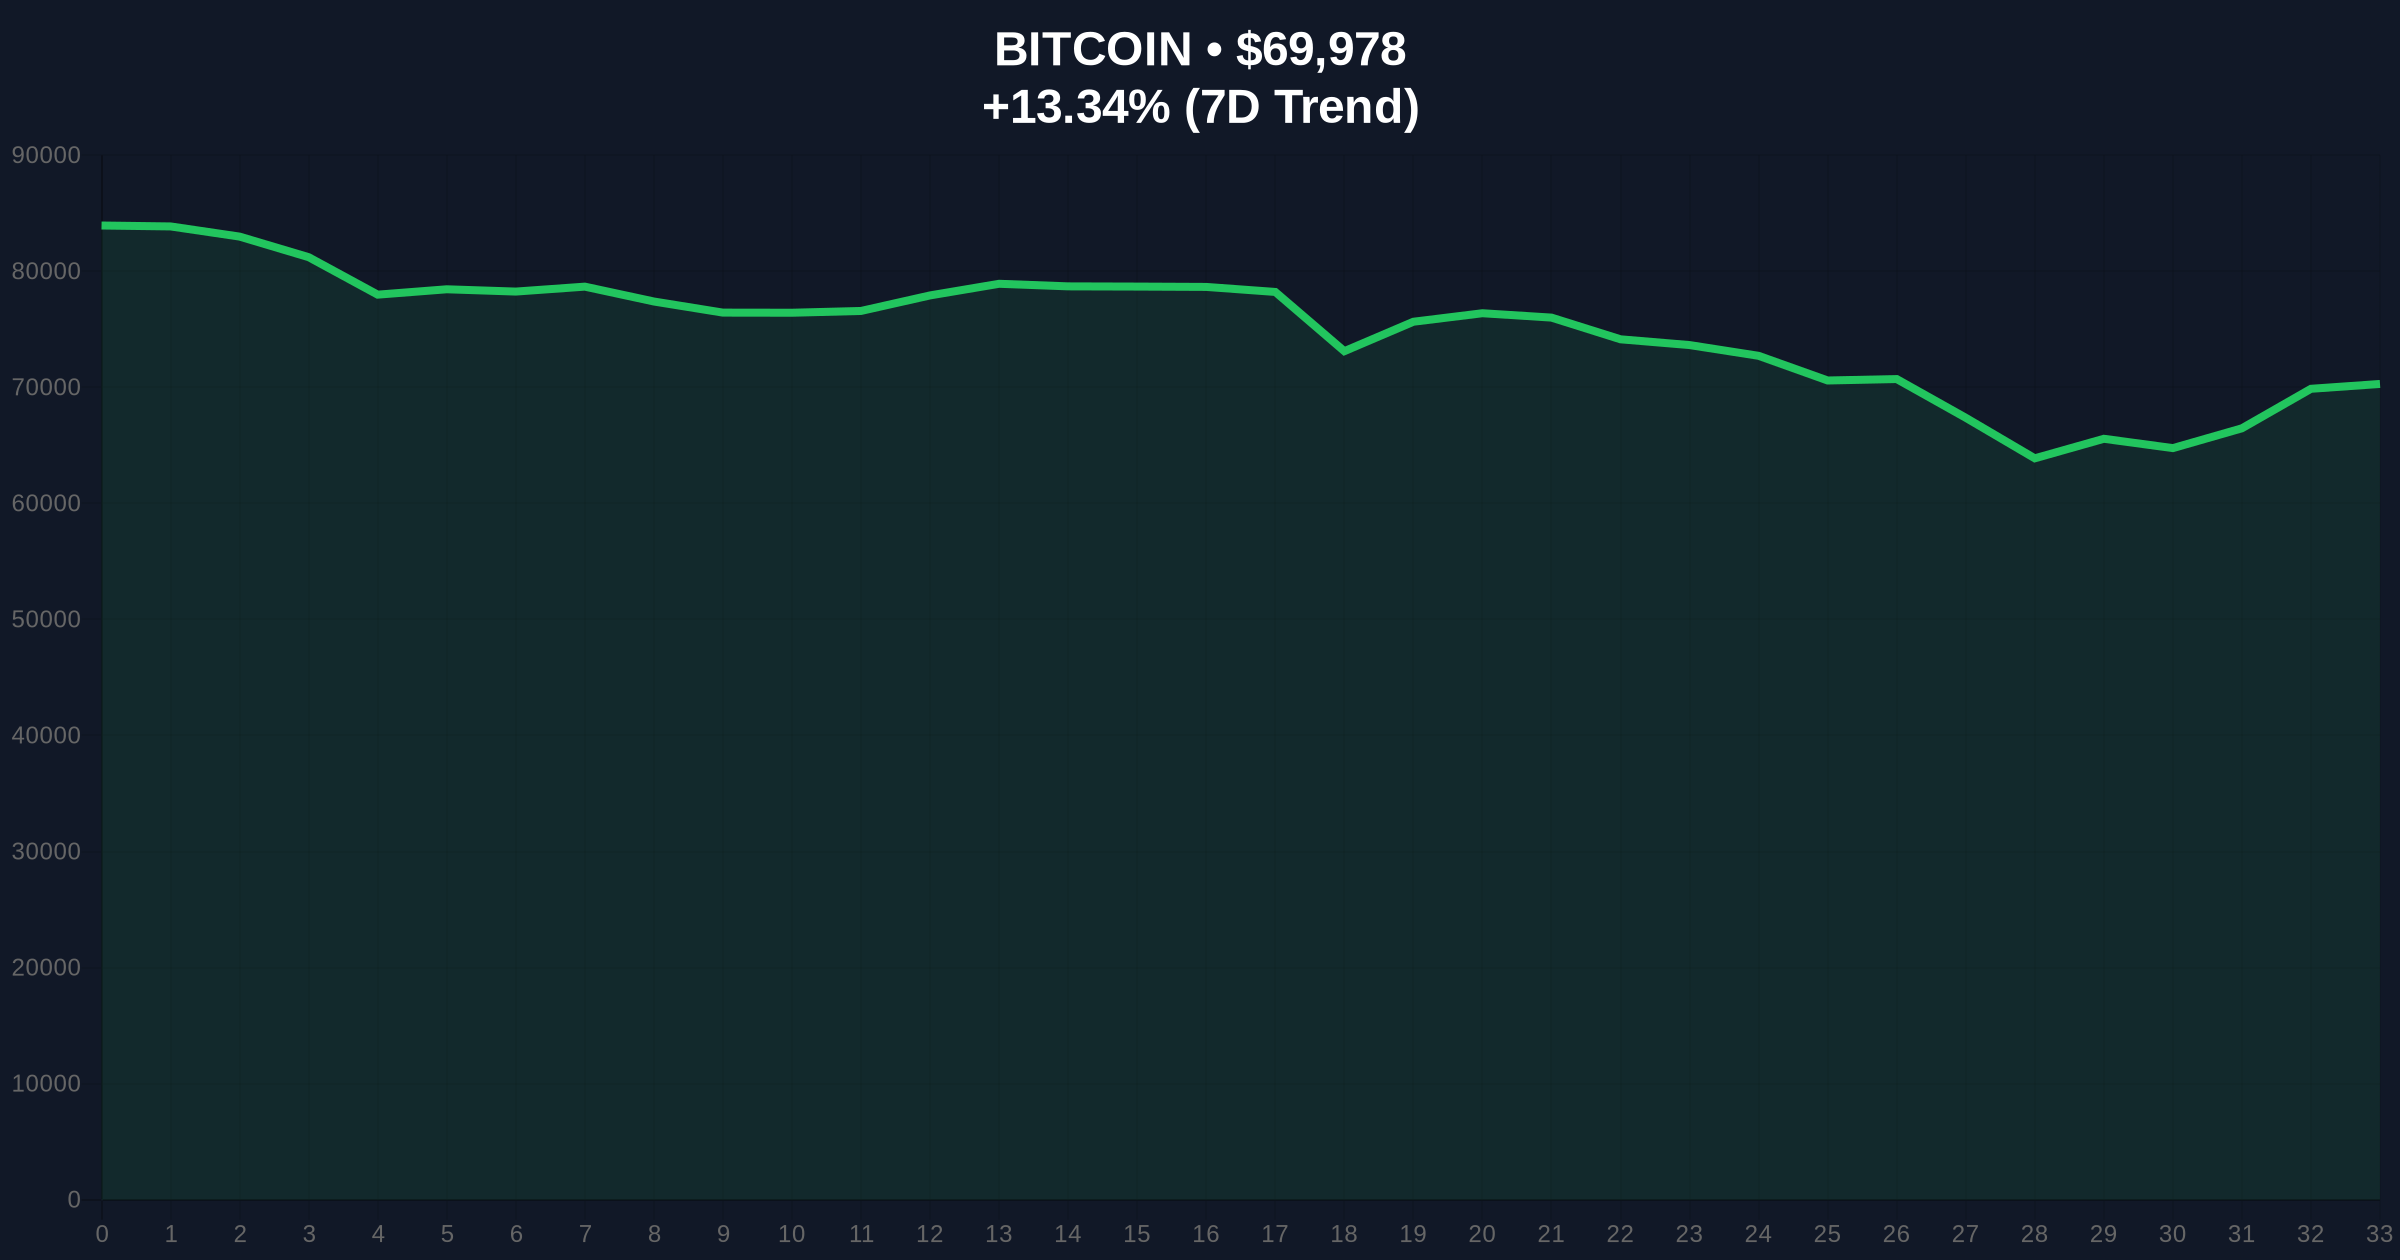
CoinNess data confirms Bitcoin breached the $70,000 support at approximately 14:00 UTC. The asset now trades at $69,998.01, marking a 13.40% decline over 24 hours. This price action occurred on the Binance USDT perpetual futures market, a primary venue for leveraged speculation. On-chain forensic data indicates elevated exchange inflows, suggesting retail capitulation is driving the sell pressure.
Consequently, the global Crypto Fear & Greed Index has plunged to an "Extreme Fear" reading of 6 out of 100. Historically, such readings coincide with local bottoms or accelerated sell-offs. The breakdown invalidates the previous consolidation range between $72,000 and $75,000, creating a new Fair Value Gap (FVG) below $70,000.
This event mirrors the June 2024 sell-off where Bitcoin lost the $60,000 level amid Mt. Gox creditor distributions. In contrast, current volatility stems from macroeconomic uncertainty rather than a single catalyst. Underlying this trend is a broader deleveraging across crypto derivatives, with estimated $800 million in long positions liquidated in the past 24 hours according to CoinGlass data.
, Bitcoin miners face intensified pressure as the price approaches the average production cost of $67,700. A sustained break below this level could force inefficient miners to sell reserves, exacerbating downside momentum. This dynamic is explored in our analysis of Bitcoin miner cost pressures during extreme fear markets.
Market structure suggests the breakdown has created a bearish order block between $70,500 and $71,200. The Relative Strength Index (RSI) on the daily chart sits at 28, indicating oversold conditions but not yet capitulation. The 200-day moving average provides dynamic support near $68,000.
Critical Fibonacci retracement levels from the 2025 all-time high of $98,000 reveal key zones. The 0.618 level at $67,500 represents major institutional interest. A break below this would target the 0.786 level at $63,000. Volume profile analysis shows significant volume nodes at $69,000 and $66,000, which may act as temporary stabilization points.
| Metric | Value | Implication |
|---|---|---|
| Current Price | $70,012 | Below key psychological support |
| 24-Hour Change | -13.40% | Accelerated selling momentum |
| Fear & Greed Index | 6/100 (Extreme Fear) | Panic sentiment, potential reversal zone |
| Market Rank | #1 | Maintains dominance despite sell-off |
| Fibonacci 0.618 Support | $67,500 | Critical institutional level |
This breakdown tests the structural integrity of Bitcoin's post-ETF bull market. Institutional liquidity cycles typically defend the 0.618 Fibonacci level during corrections. A failure here would signal deeper portfolio rebalancing by macro funds. Retail market structure shows increased UTXO (Unspent Transaction Output) movements from older wallets, indicating long-term holders are distributing.
Real-world evidence includes rising funding rates turning negative across perpetual swap markets. This suggests shorts are paying longs, creating potential for a violent short squeeze if sentiment reverses. The breakdown also impacts correlated assets, with Ethereum testing its own critical support at $3,800.
"The $70,000 break is technically significant but must be contextualized within broader liquidity conditions. On-chain data indicates miner outflow rates remain within historical norms, suggesting this is not a fundamental breakdown. However, the Extreme Fear reading suggests sentiment-driven overshooting that often creates tactical buying opportunities for institutions."
Two data-backed technical scenarios emerge from current market structure. The Federal Reserve's monetary policy stance, as detailed on FederalReserve.gov, will heavily influence which scenario unfolds.
The 12-month institutional outlook hinges on whether this correction remains within the bounds of historical drawdowns. Previous cycles show 30-40% corrections are common during bull markets. A hold above $67,500 would maintain the 5-year horizon thesis of continued institutional adoption driving new highs.

Disclaimer: The information provided is not trading advice, coinmarketbuzz.com holds no liability for any investments made based on the information provided on this page. We strongly recommend independent research and/or consultation with a qualified professional before making any investment decisions.
coinmarketbuzz.com leverages advanced AI technology to analyze market data. All content is fact-checked and reviewed by our editorial team to ensure accuracy and neutrality.