Loading News...
Loading...
Loading News...

VADODARA, February 7, 2026 — Bitcoin miners face mounting financial pressure as newly revealed Q3 2025 data shows average production costs exceeding current market prices. This daily crypto analysis examines whether this fundamental mismatch will trigger the feared miner capitulation event that historically precedes major market bottoms.
Ju Ki-young, CEO of CryptoQuant, disclosed critical data on social media platform X. According to Marathon Digital Holdings' Q3 2025 financial report, the average cost to mine one Bitcoin reached approximately $67,704. CryptoQuant Senior Analyst Julio Moreno immediately contextualized this figure against current market conditions.
Moreno stated that at prevailing price levels, Bitcoin miners likely operate at a loss. He warned that sustained price weakness could force miners to liquidate holdings to cover operational expenses. This creates a fundamental supply-demand imbalance that technical analysis must now incorporate.
Historically, miner capitulation events have served as reliable contrarian indicators. The 2018-2019 bear market bottom coincided with widespread miner shutdowns when Bitcoin traded below production costs for extended periods. In contrast, the 2021 cycle saw miners accumulate during profitable periods, creating the fuel for the subsequent rally.
Underlying this trend is a simple economic reality: unprofitable mining operations cannot sustain themselves indefinitely. The current situation mirrors early 2023 conditions when Bitcoin briefly traded below the $20,000 mining cost threshold before recovering. Market structure suggests we may be testing a similar inflection point.
Related developments in market sentiment include the Crypto Fear & Greed Index hitting extreme fear levels and Bitcoin's recent price action defying this sentiment.
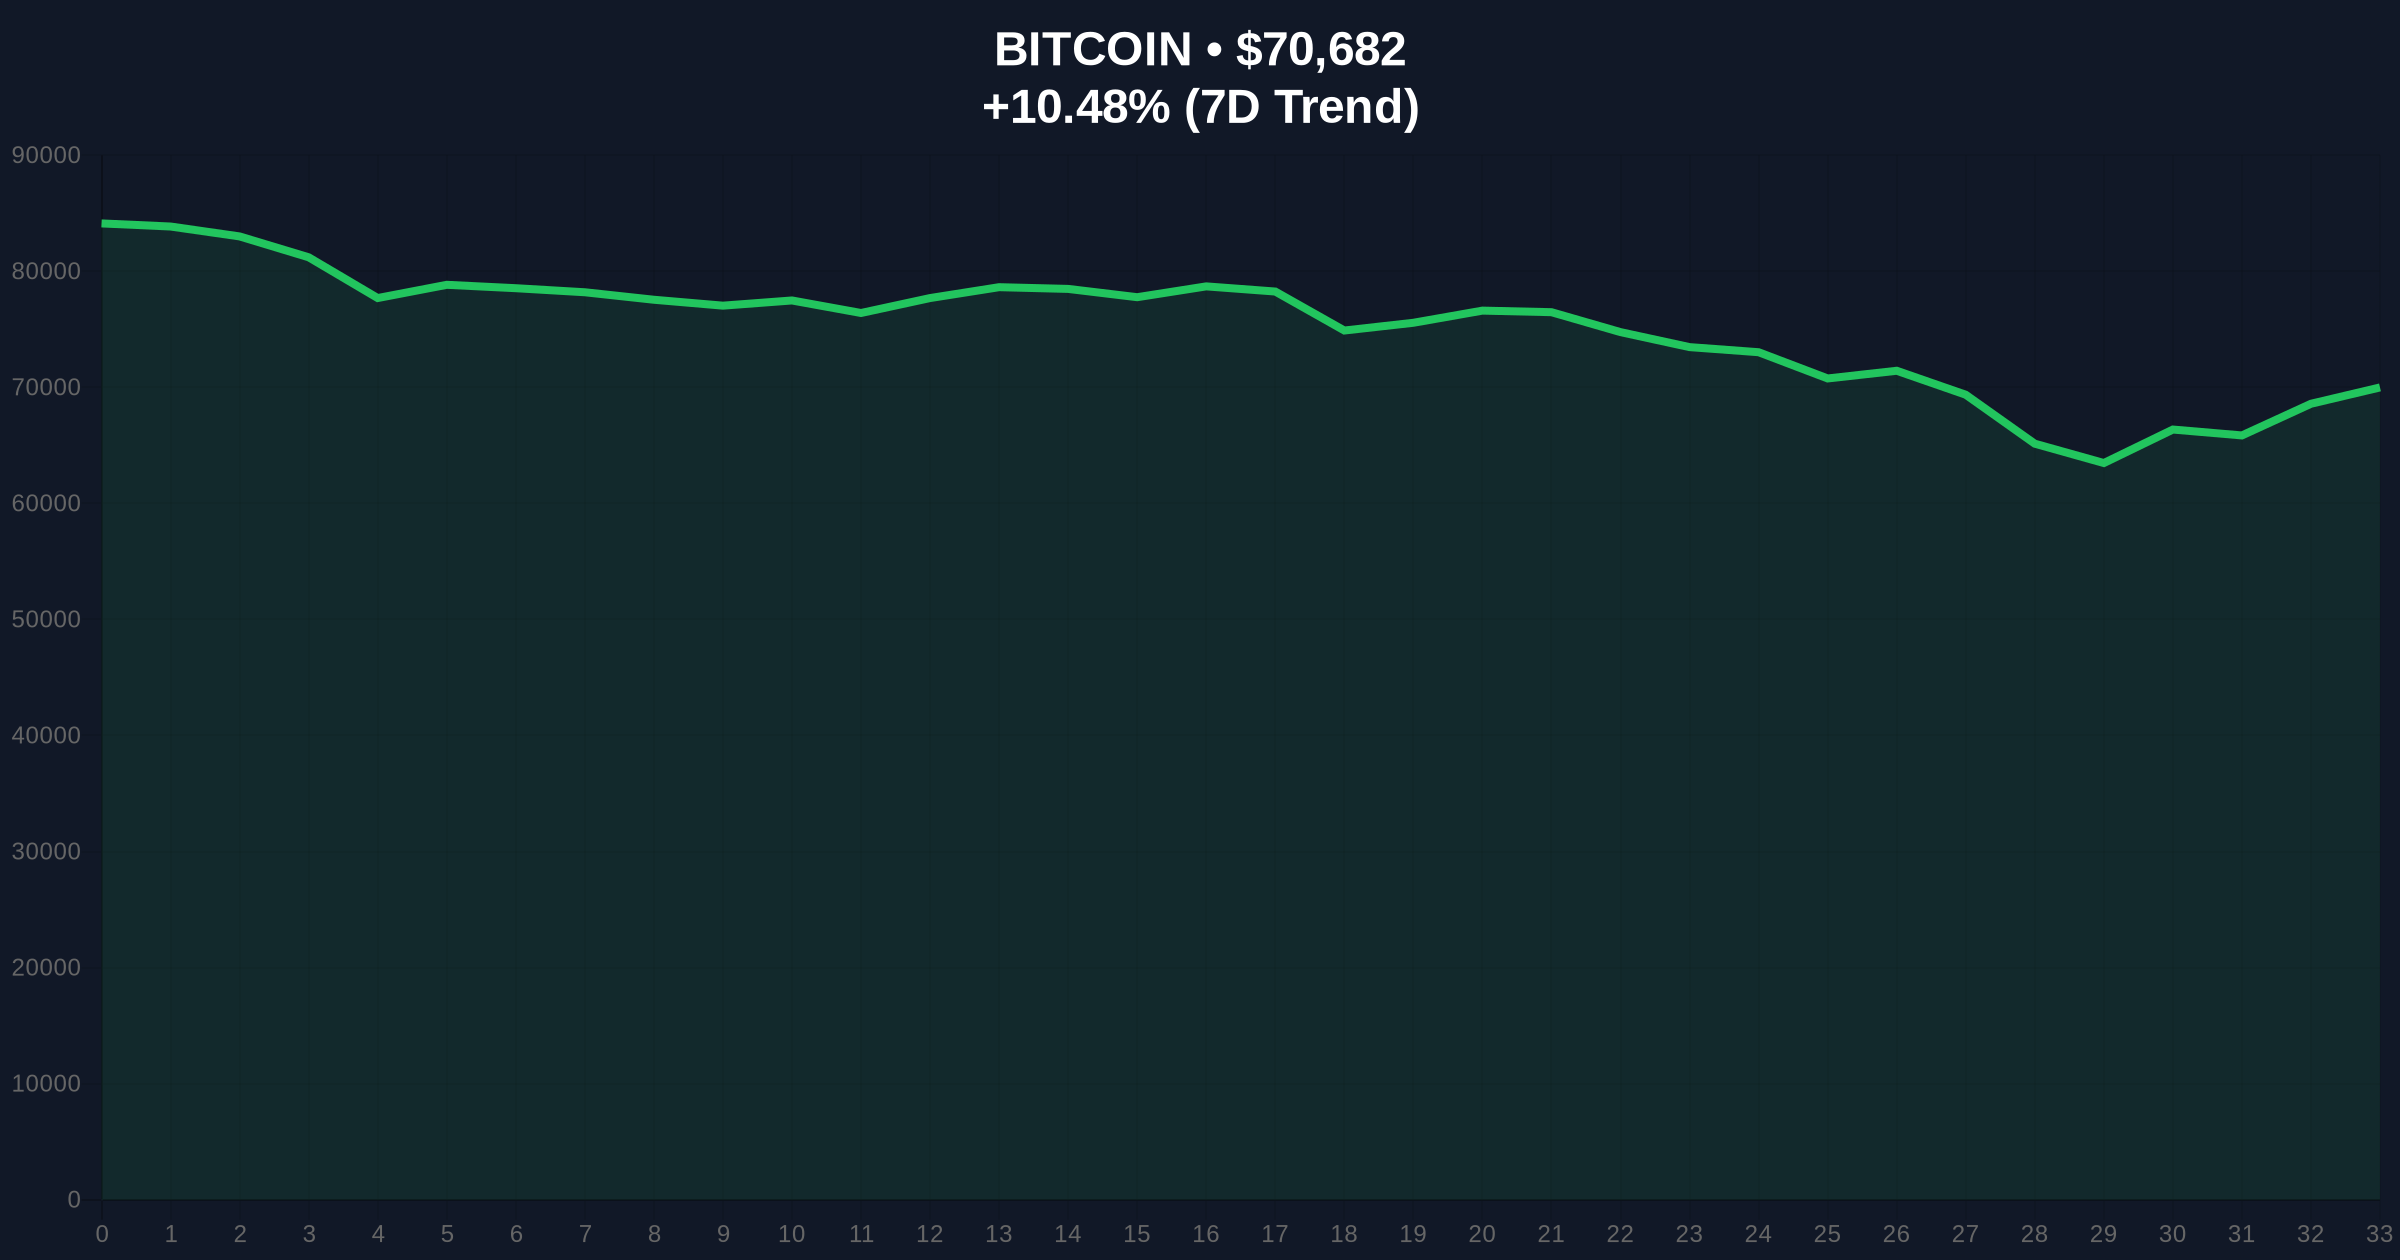
Market structure currently shows Bitcoin trading around $70,566, barely above the revealed $67,704 average mining cost. This creates a critical Fair Value Gap (FVG) between production economics and market pricing. The $67,704 level now serves as a major psychological support zone.
Technical analysis reveals additional layers to this narrative. The Fibonacci 0.618 retracement level from the 2024 all-time high sits at approximately $68,200, creating a confluence zone with the mining cost data. , on-chain UTXO age bands indicate long-term holders have not yet begun significant distribution, suggesting miner selling could be the primary near-term pressure.
Volume Profile analysis shows weak accumulation below $70,000, indicating institutional buyers remain cautious. This creates a potential Liquidity Grab scenario if prices break below the mining cost support. The Order Block between $67,000 and $69,000 becomes critical for determining next directional moves.
| Metric | Value | Significance |
|---|---|---|
| Q3 2025 Average Mining Cost | $67,704 | Break-even point for miners |
| Current Bitcoin Price | $70,566 | Only 4.2% above mining cost |
| 24-Hour Price Change | -10.30% | Accelerating downward pressure |
| Crypto Fear & Greed Index | 9/100 (Extreme Fear) | Historically contrarian signal |
| Price vs. Mining Cost Spread | $2,862 | Thin margin for miner profitability |
Miners represent a fundamental supply source in Bitcoin's market structure. According to blockchain analytics from Glassnode, miner reserves currently hold approximately 1.8 million BTC. Forced selling from even a fraction of this inventory could overwhelm current buy-side liquidity.
Institutional liquidity cycles typically respond to such fundamental pressures with increased volatility. The current situation creates a potential Gamma Squeeze scenario where options market makers adjust hedges rapidly as prices approach critical levels. Retail market structure, already fragile due to extreme fear sentiment, may not withstand sustained miner selling.
The Federal Reserve's monetary policy decisions, documented on FederalReserve.gov, further complicate this picture. Rising interest rates increase mining operational costs through electricity and financing expenses, potentially pushing the break-even point even higher.
"The $67,704 figure represents more than just a production cost—it's a psychological threshold for market participants. Historical data from previous cycles shows that when Bitcoin trades below miner production costs for extended periods, it typically marks either a major bottom or triggers accelerated capitulation. The current extreme fear sentiment reading of 9/100 suggests we're approaching one of these inflection points."
Two primary technical scenarios emerge from current market structure analysis.
The 12-month institutional outlook depends heavily on whether Bitcoin establishes a base above or below the mining cost threshold. Historical cycles suggest that if prices stabilize above $67,704 for multiple weeks, it could signal the worst of the selling pressure has passed. Conversely, sustained trading below this level would likely extend the current corrective phase through Q2 2026.

Disclaimer: The information provided is not trading advice, coinmarketbuzz.com holds no liability for any investments made based on the information provided on this page. We strongly recommend independent research and/or consultation with a qualified professional before making any investment decisions.
coinmarketbuzz.com leverages advanced AI technology to analyze market data. All content is fact-checked and reviewed by our editorial team to ensure accuracy and neutrality.