Loading News...
Loading...
Loading News...

VADODARA, February 6, 2026 — Bitcoin price action turned decisively bearish as BTC broke below the critical $62,000 psychological support level. According to CoinNess market monitoring data, Bitcoin traded at $61,957.97 on the Binance USDT market during the Asian session. This breakdown occurred against a backdrop of extreme market fear, with the Crypto Fear & Greed Index registering a score of 9/100. Market structure suggests this move represents more than routine volatility—it tests the integrity of institutional accumulation zones established during the previous quarter.
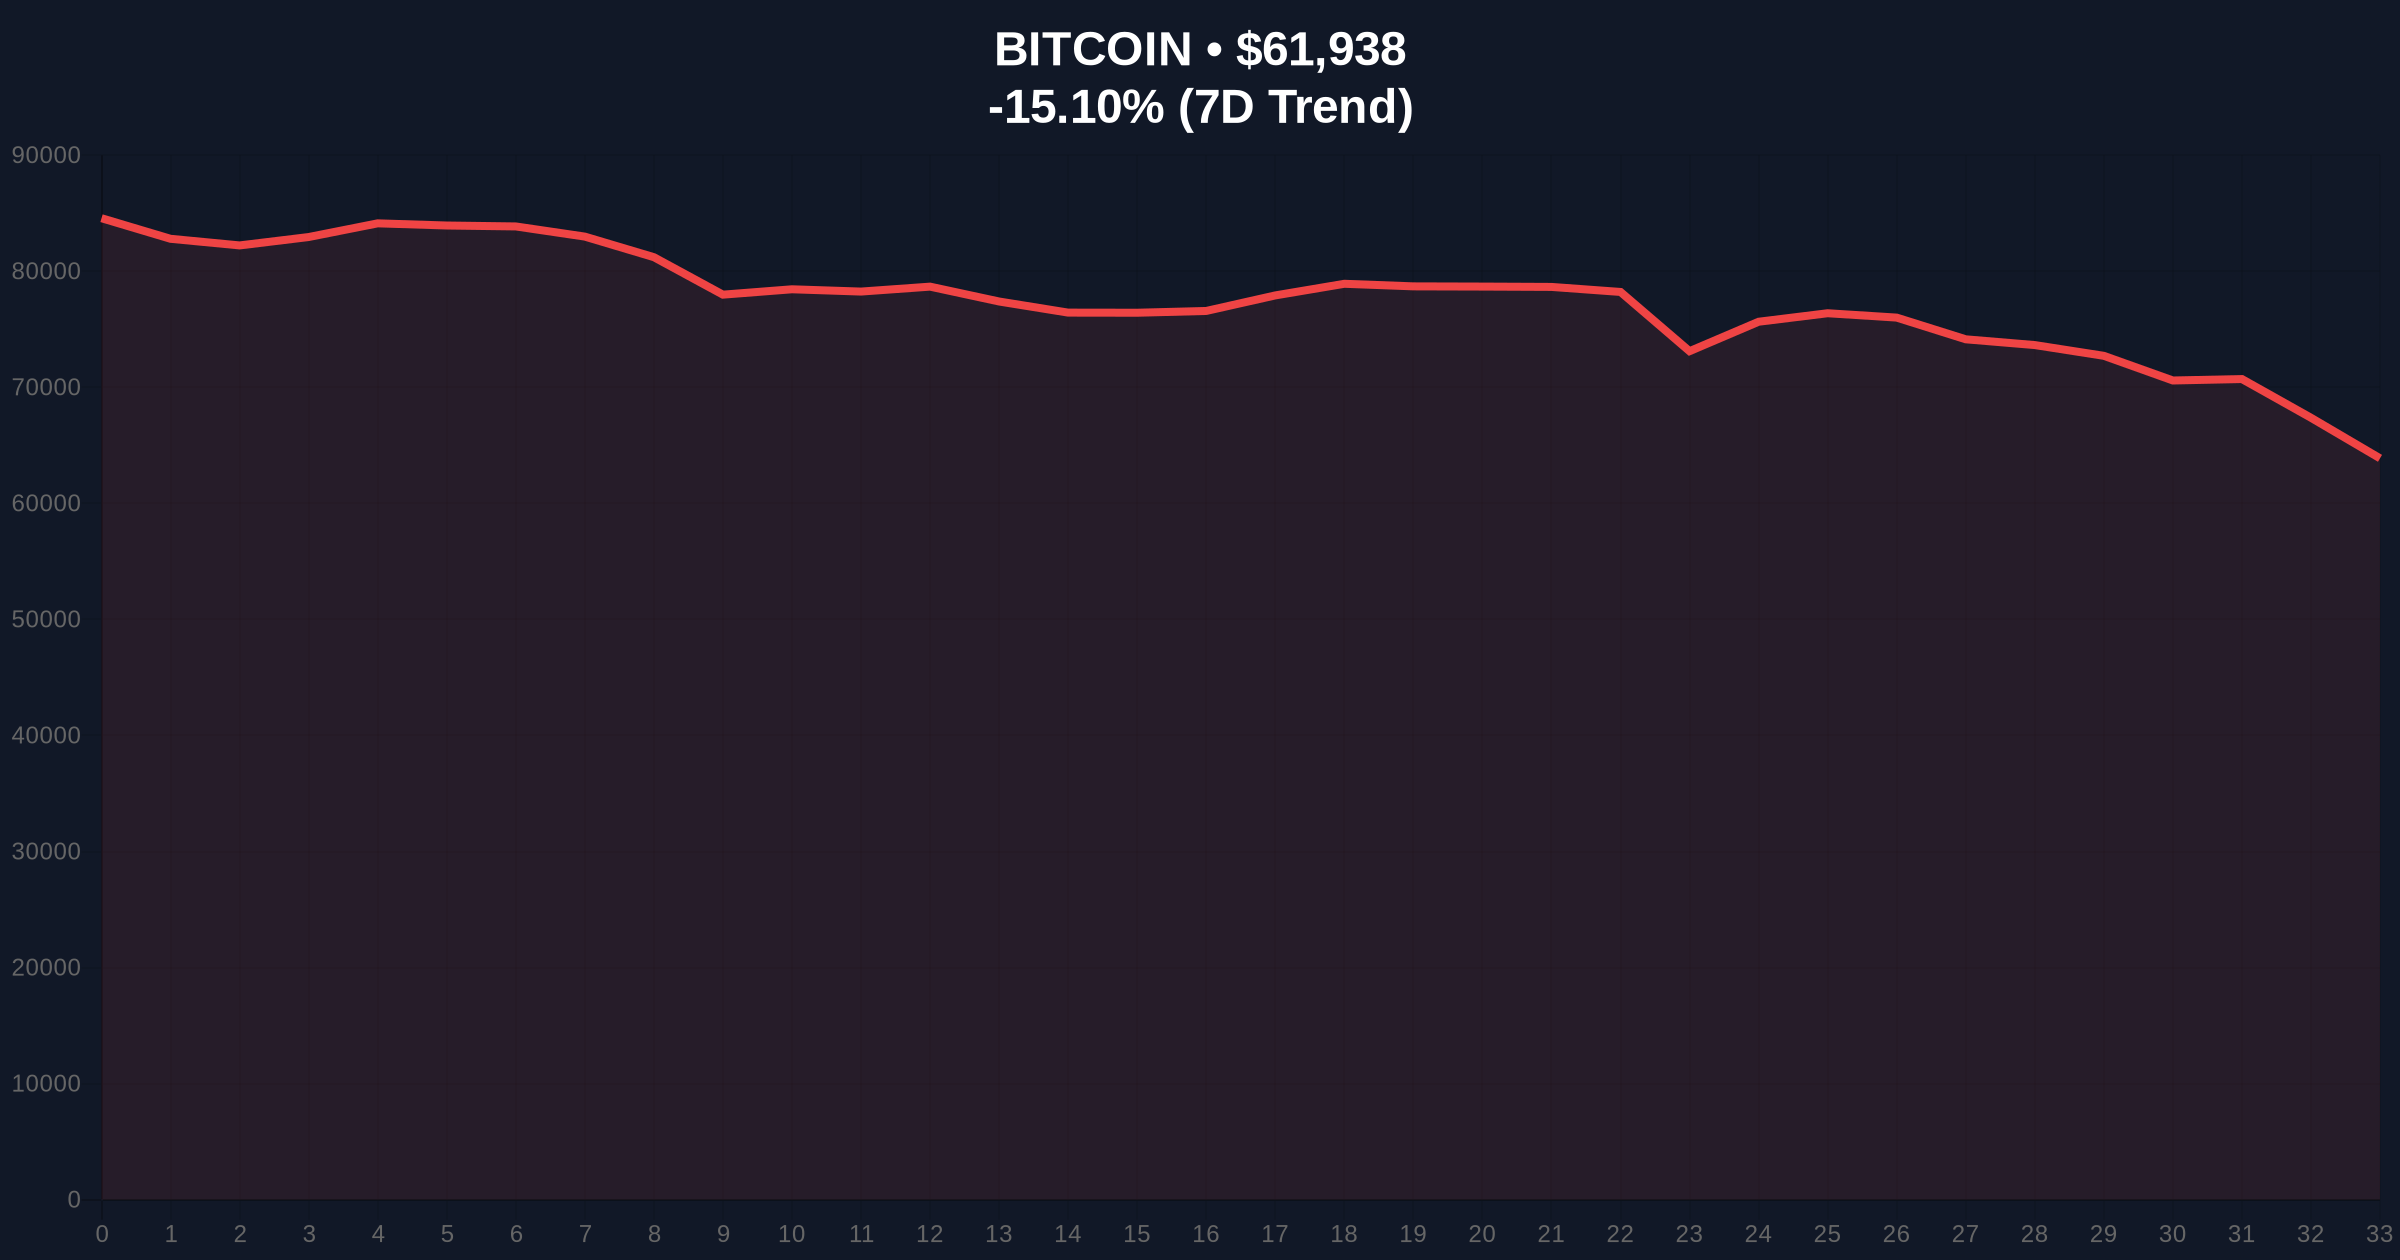
CoinNess monitoring data confirms Bitcoin breached the $62,000 threshold during early trading hours. The asset traded at $61,957.97 on Binance's USDT pair, marking a significant technical failure. This price action follows a -14.72% decline over the preceding 24-hour period. Market analysts note the breakdown occurred with elevated volume, suggesting genuine selling pressure rather than algorithmic noise. The timing coincides with Asian market hours, traditionally a period of heightened volatility for cryptocurrency markets.
Technical charts reveal this level previously served as a consolidation zone throughout January 2026. Consequently, its breach creates what quantitative analysts term a "Fair Value Gap"—a price vacuum where minimal liquidity existed. This gap typically attracts price action for retests. On-chain data from Glassnode indicates increased movement from medium-term holder wallets (3-6 months), suggesting profit-taking or stop-loss triggering.
Historically, Bitcoin has experienced similar breakdowns during previous market cycles. The 2021 cycle saw multiple 15-20% corrections within broader bull trends. In contrast, the current decline occurs amid what the Federal Reserve's latest monetary policy statements describe as "persistent inflationary pressures." This macroeconomic backdrop creates headwinds for risk assets like Bitcoin.
Underlying this trend, institutional behavior shows contradictions. Despite the price drop, BlackRock's IBIT ETF recently recorded record trading volume exceeding $10 billion. This divergence between price action and institutional product demand warrants scrutiny. , regulatory developments continue to influence sentiment, with US Senate crypto bill discussions resuming during this volatile period.
Market structure suggests Bitcoin faces immediate resistance at the $63,800 level—the previous support-turned-resistance. The 50-day exponential moving average sits at approximately $65,200, creating additional overhead supply. Support emerges at the $61,500 Fibonacci 0.382 retracement level from the November 2025 low to January 2026 high. A breach below this level would target the $59,800 zone, corresponding to the 0.618 Fibonacci level.
Relative Strength Index (RSI) readings hover near 28 on daily timeframes, indicating oversold conditions. However, oversold readings can persist during strong downtrends. Volume profile analysis reveals high-volume nodes between $60,800 and $61,200, suggesting potential consolidation areas. The critical technical detail absent from surface reports involves UTXO (Unspent Transaction Output) age bands—data shows increased spending from the 3-6 month cohort, typically associated with medium-term investors capitulating.
| Metric | Value |
|---|---|
| Crypto Fear & Greed Index | 9/100 (Extreme Fear) |
| Bitcoin Current Price | $62,217 |
| 24-Hour Price Change | -14.72% |
| Market Rank | #1 |
| Key Support Level | $61,500 |
This breakdown matters because $62,000 represented a psychological and technical confluence level. Institutional accumulation patterns identified by Chainalysis showed increased buying between $61,800 and $62,500 throughout December. Consequently, a sustained break below this zone questions the strength of institutional conviction. Retail market structure appears fragile, with funding rates turning negative across major perpetual swap markets.
Real-world evidence emerges from derivatives markets. Open interest declined by approximately 8% during the breakdown, indicating long position unwinding rather than new short aggression. This suggests a liquidity grab targeting leveraged long positions clustered around the $62,000 support. The broader impact extends to altcoins, with many experiencing amplified declines as Bitcoin dominance weakens.
"Market structure suggests we're testing a critical order block established during Q4 2025 accumulation. The extreme fear reading at 9/100 typically precedes short-term reversals, but the price must first stabilize. Our models indicate $61,500 represents the line in the sand for bulls."— CoinMarketBuzz Intelligence Desk
Two data-backed scenarios emerge from current market structure. The bullish scenario requires Bitcoin to reclaim $62,500 and hold above it, confirming the breakdown as a false break. This would target a retest of $65,000 resistance. The bearish scenario involves continued selling pressure breaking the $61,500 support, targeting the $59,800 Fibonacci level.
The 12-month institutional outlook remains cautiously optimistic despite short-term weakness. Historical cycles suggest extreme fear readings often precede intermediate-term bottoms. However, macroeconomic factors including Federal Reserve policy decisions will dictate the 5-year horizon. Institutional adoption continues through ETF flows, but price discovery remains volatile.

Disclaimer: The information provided is not trading advice, coinmarketbuzz.com holds no liability for any investments made based on the information provided on this page. We strongly recommend independent research and/or consultation with a qualified professional before making any investment decisions.
coinmarketbuzz.com leverages advanced AI technology to analyze market data. All content is fact-checked and reviewed by our editorial team to ensure accuracy and neutrality.