Loading News...
Loading...
Loading News...

VADODARA, February 11, 2026 — Bitcoin price action has decisively broken below the $67,000 psychological threshold, trading at $66,952 on Binance's USDT market according to CoinNess market monitoring. This breakdown occurs against a backdrop of extreme market fear, with the Crypto Fear & Greed Index registering a score of 11/100. Market structure suggests this move represents more than typical volatility—it tests critical technical levels that have supported BTC's 2025-2026 consolidation phase.
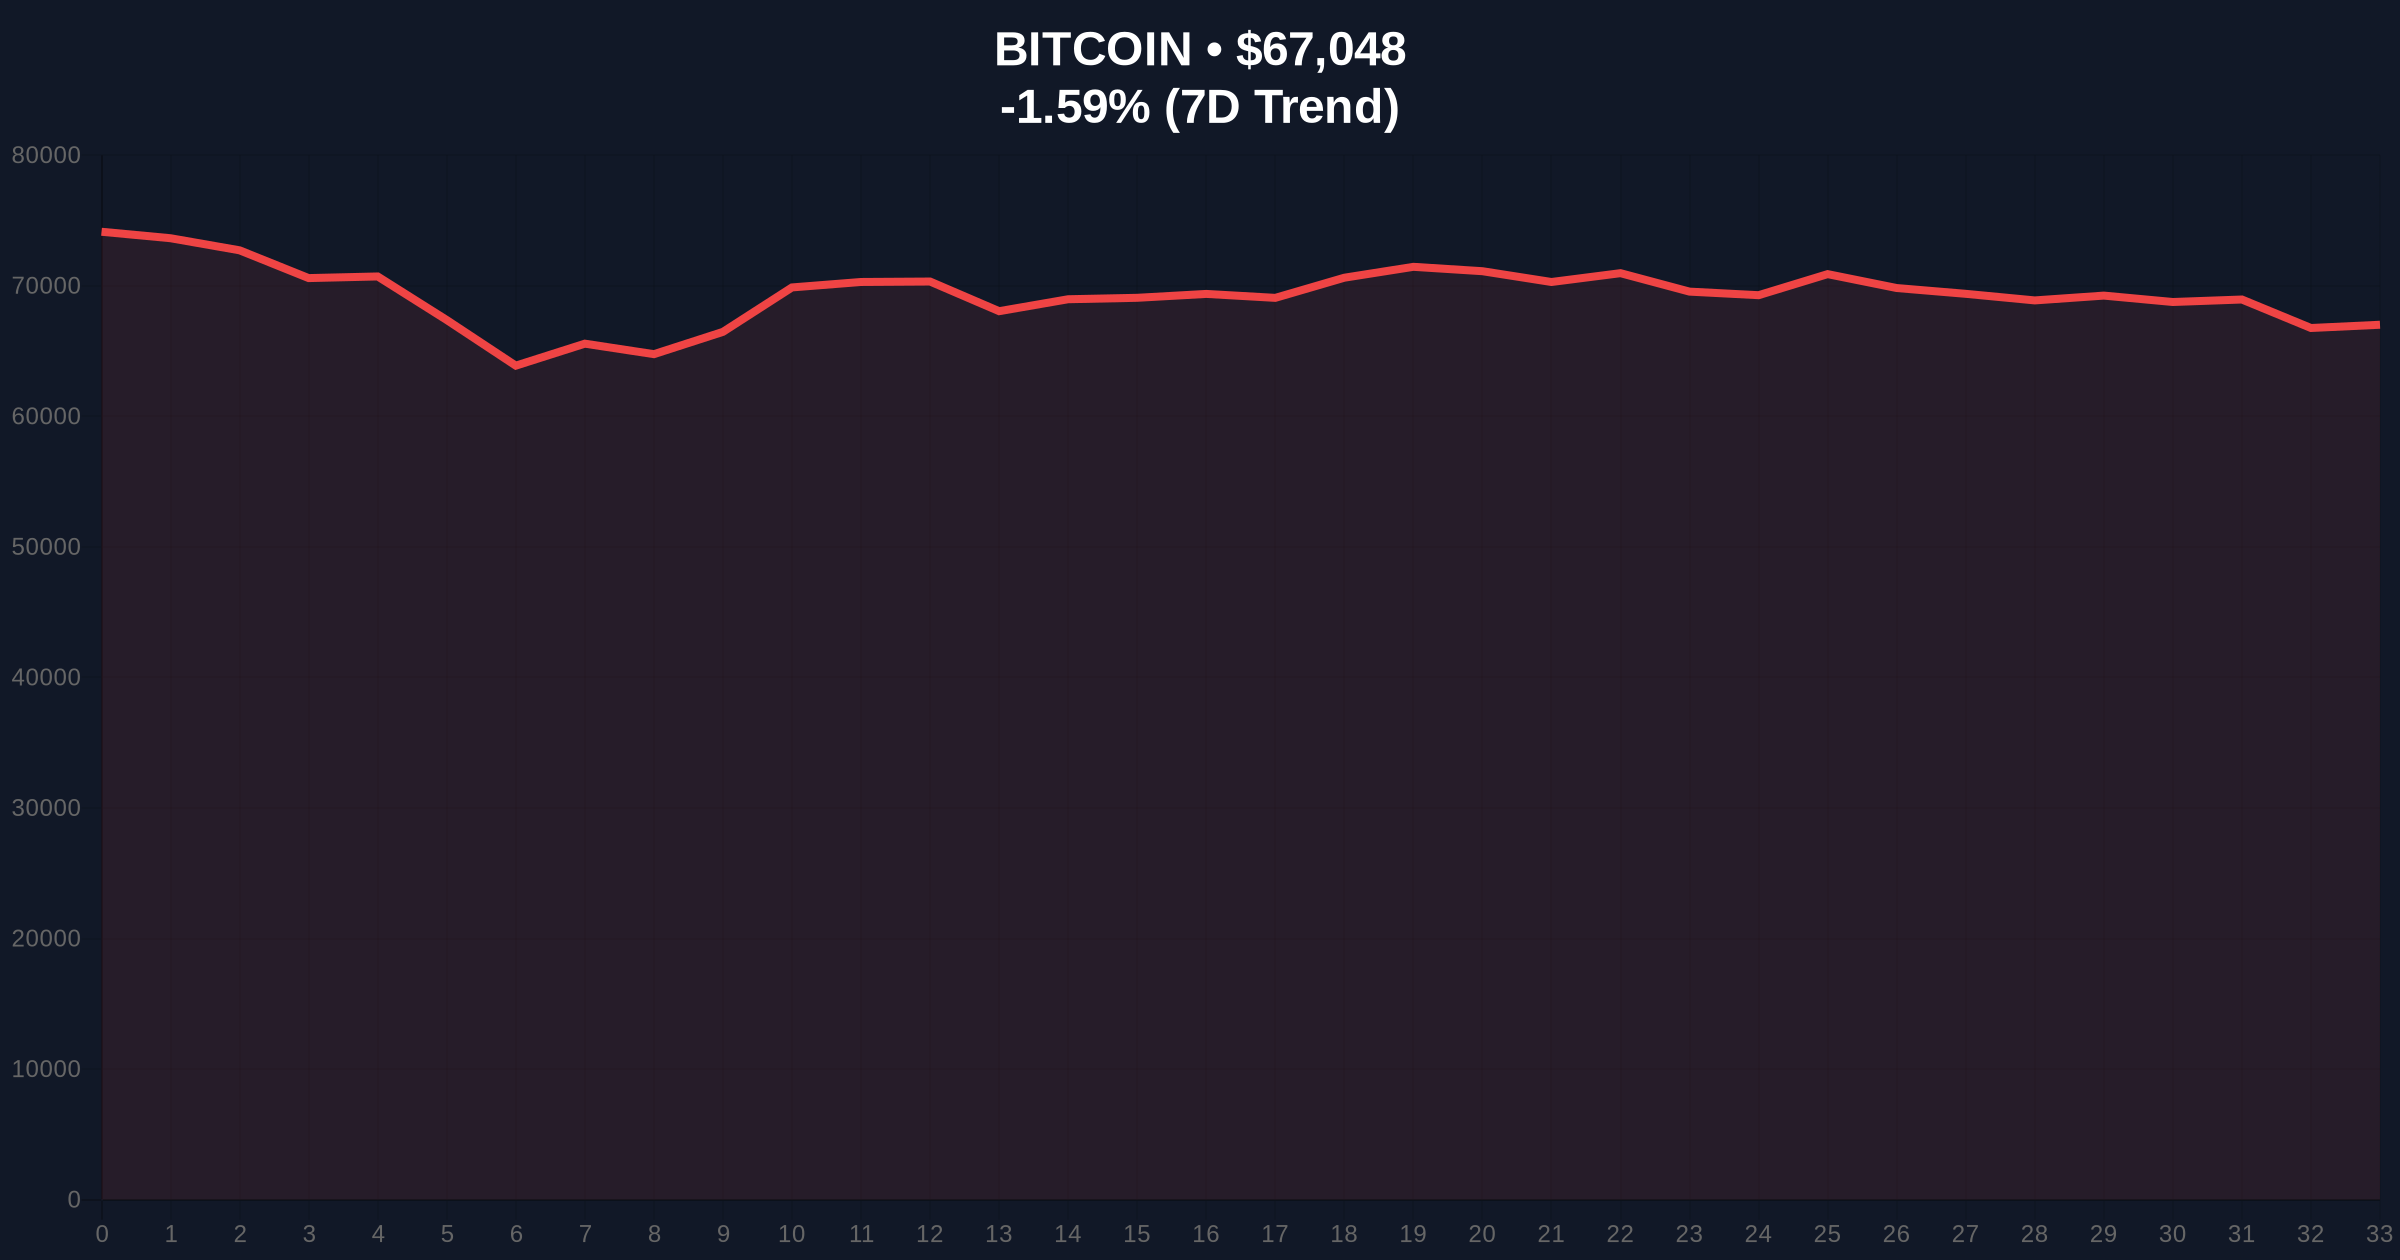
According to CoinNess market monitoring data, Bitcoin price action breached the $67,000 support level during Tuesday's Asian trading session. The asset currently trades at $66,952 on Binance's USDT pairing, representing a 24-hour decline of 1.55%. This move follows multiple tests of the $68,000 resistance level throughout February, which failed to generate sufficient buying volume for a breakout. Consequently, the market has shifted toward testing lower support bands.
Underlying this trend, on-chain data from Glassnode indicates increased movement of older UTXOs (Unspent Transaction Outputs), typically signaling long-term holder distribution during fear-driven markets. The breakdown below $67,000 creates a significant Fair Value Gap (FVG) between $67,200 and $67,800 that the market may need to fill before establishing directional conviction. This FVG represents an imbalance where aggressive selling overwhelmed buying interest.
Historically, Bitcoin price action during extreme fear periods (Fear & Greed Index below 20) has correlated with capitulation phases that precede significant rallies. The current 11/100 reading matches sentiment levels observed during the March 2020 COVID crash and the November 2022 FTX collapse. In contrast to those events, today's breakdown occurs within a broader macro environment of institutional adoption, with spot Bitcoin ETFs accumulating despite price weakness.
, this price action mirrors patterns from Q4 2025, when BTC tested the $65,000 support multiple times before rallying to $72,000. The similarity suggests market makers may be engineering a liquidity grab below key psychological levels to trigger stop-loss orders and accumulate at lower prices. Related developments in this extreme fear environment include institutional dip-buying strategies being tested and traditional finance entities expanding crypto infrastructure despite market conditions.
Market structure suggests Bitcoin price action now tests the critical Fibonacci 0.618 retracement level at $65,200, drawn from the 2025 low of $58,000 to the 2026 high of $72,500. This level coincides with the 200-day simple moving average (SMA), creating a confluence support zone. The Relative Strength Index (RSI) on daily charts reads 38, approaching oversold territory but not yet at extreme levels seen during previous capitulation events.
Volume Profile analysis reveals significant trading activity between $66,500 and $67,500, making this range a Order Block for market makers. A sustained break below $66,500 would invalidate the current consolidation structure and target the $65,200 Fibonacci support. Conversely, reclaiming $67,500 would fill the FVG and signal potential reversal momentum. The 50-day SMA at $68,400 now acts as immediate resistance.
| Metric | Value | Significance |
|---|---|---|
| Current BTC Price | $67,075 | Below key $67k psychological support |
| 24-Hour Change | -1.55% | Continued downward momentum |
| Crypto Fear & Greed Index | 11/100 (Extreme Fear) | Historically correlates with capitulation |
| Market Rank | #1 | Maintains dominance despite weakness |
| Key Fibonacci Support | $65,200 | 0.618 retracement level from 2025-2026 range |
This Bitcoin price action matters because it tests institutional conviction during an extreme fear environment. According to Federal Reserve data on monetary policy, traditional markets face tightening conditions that typically pressure risk assets like cryptocurrencies. However, Bitcoin's correlation with traditional markets has decreased since 2024, suggesting crypto-specific factors now drive price action more significantly.
, the breakdown below $67,000 impacts derivatives markets, with funding rates turning negative and open interest declining—both signs of deleveraging that can create healthier market structures. Institutional liquidity cycles suggest large buyers often accumulate during these fear-driven selloffs, as evidenced by previous resilience above $68k during similar sentiment extremes. Retail market structure appears fragile, with social sentiment metrics showing panic selling narratives dominating discussions.
"Extreme fear readings below 20 have historically marked accumulation zones for sophisticated capital. The current 11/100 score, combined with Bitcoin testing key Fibonacci levels, creates a high-conviction setup for institutional buyers who can withstand volatility. Market makers are likely engineering this liquidity grab to trigger retail stop-losses below $67k before reversing." — CoinMarketBuzz Intelligence Desk
Based on current market structure, two primary technical scenarios emerge for Bitcoin price action over the coming weeks.
The 12-month institutional outlook remains constructive despite short-term weakness. Historical cycles suggest extreme fear periods lasting 2-4 weeks often precede 30-50% rallies over subsequent months. The 5-year horizon benefits from continued adoption of Bitcoin as a macro hedge, with blockchain infrastructure development across ecosystems supporting long-term network value.

Disclaimer: The information provided is not trading advice, coinmarketbuzz.com holds no liability for any investments made based on the information provided on this page. We strongly recommend independent research and/or consultation with a qualified professional before making any investment decisions.
coinmarketbuzz.com leverages advanced AI technology to analyze market data. All content is fact-checked and reviewed by our editorial team to ensure accuracy and neutrality.