Loading News...
Loading...
Loading News...

VADODARA, January 19, 2026 — According to Glassnode's weekly market report, Bitcoin's upward momentum has weakened, with current price action indicating range-bound consolidation rather than a major trend reversal. This daily crypto analysis examines the underlying on-chain metrics and derivatives market signals that define the current market structure.
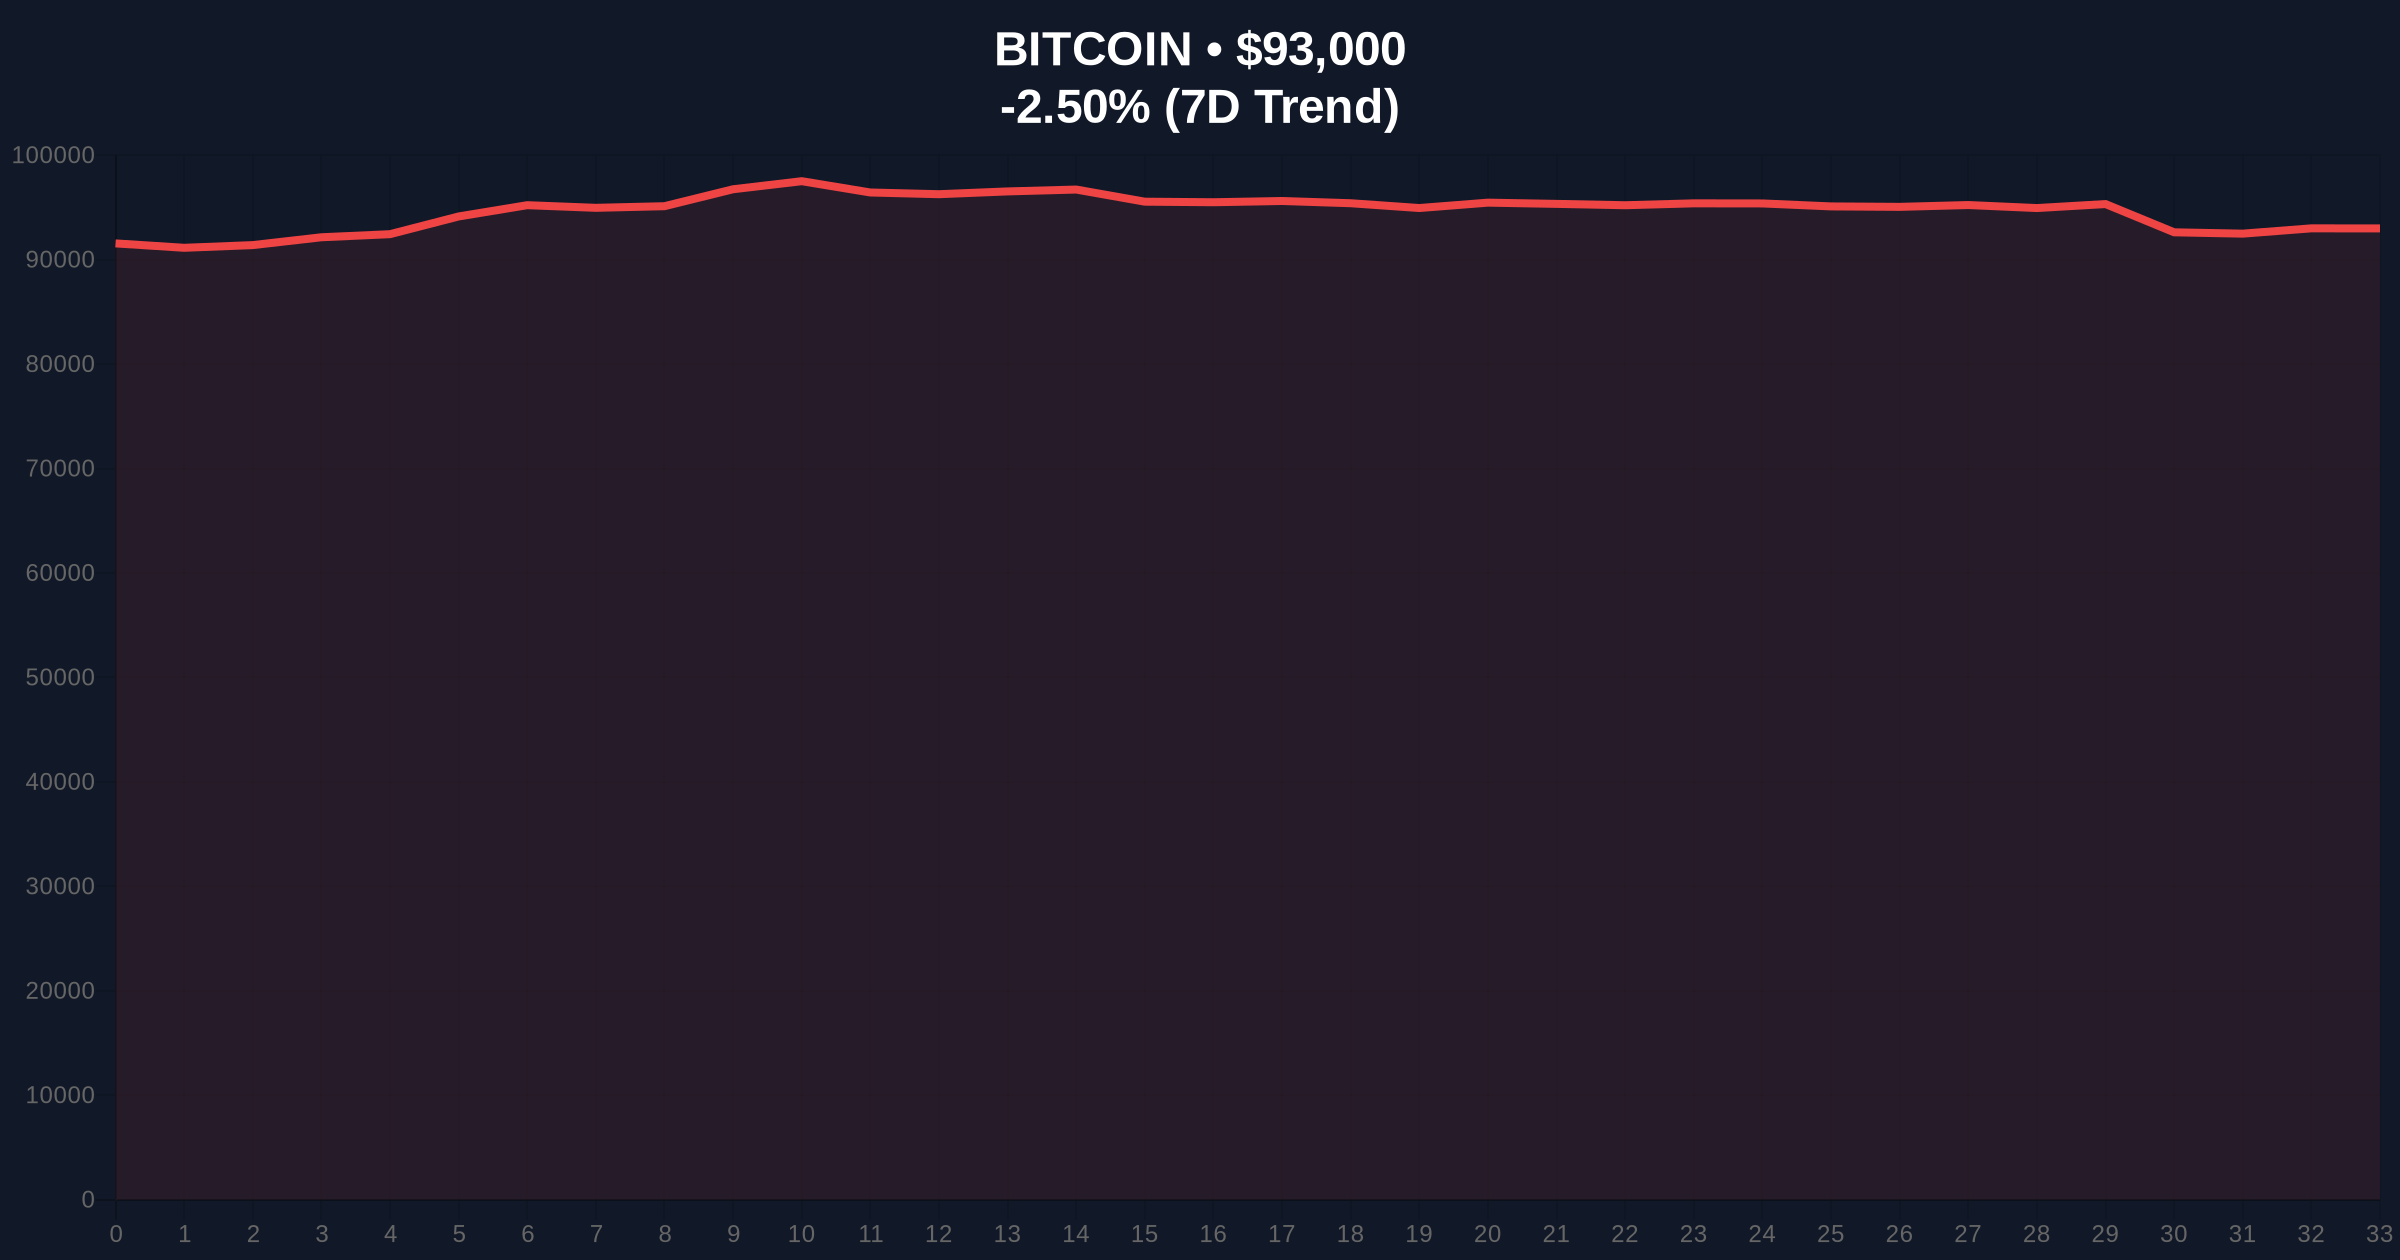
Bitcoin's current consolidation phase mirrors historical patterns observed during the 2021 cycle, where extended periods of sideways movement preceded significant directional moves. According to on-chain data from Glassnode, the market has transitioned from a parabolic advance to a more sustainable accumulation phase. This shift typically occurs when long-term holders increase their positions while short-term speculators exit, creating a more stable foundation for future appreciation. The current price action around $93,000 represents a critical test of the 0.618 Fibonacci retracement level from the recent $98,000 high, a technical zone that has historically served as either springboard or trapdoor for Bitcoin's trajectory.
Glassnode's analysis reveals Bitcoin fell from a recent high of $98,000 to the low $90,000s this week, representing a 7-8% correction. The firm's weekly market report indicates selling pressure in the spot market is gradually easing as trading volume slightly recovers, but demand remains uneven due to relatively low buying pressure. According to the derivatives market data, futures open interest has shown a slight increase while funding rates have dropped, creating mixed signals about trader positioning. U.S. spot ETFs have returned to net inflows, providing institutional support, while on-chain activity remains stable with no significant spikes in UTXO age distribution or miner outflow.
Market structure suggests Bitcoin is currently testing a critical Fair Value Gap (FVG) between $91,500 and $93,500, created during the rapid descent from $98,000. The Volume Profile indicates significant liquidity accumulation at $90,800, creating a strong support zone that has been tested multiple times this week. The 50-day moving average at $94,200 currently acts as dynamic resistance, while the 200-day moving average at $87,500 provides longer-term structural support. The RSI reading of 42 suggests neutral momentum with slight bearish bias, consistent with consolidation phases. According to technical analysis principles documented on institutional resources like the Federal Reserve's research on distributed ledger technology, such consolidation periods often precede significant volatility expansions when market participants reach consensus on direction.
| Metric | Value | Significance |
|---|---|---|
| Crypto Fear & Greed Index | 44/100 (Fear) | Indicates cautious market sentiment |
| Bitcoin Current Price | $92,995 | 7.1% below recent ATH |
| 24-Hour Price Change | -2.51% | Consolidation within range |
| Market Rank | #1 | Dominance remains intact |
| Recent High | $98,000 | Key resistance level |
For institutional investors, this consolidation phase represents an opportunity to accumulate at more favorable risk-adjusted entry points, particularly given the return to net inflows in U.S. spot ETFs. The gradual improvement in market structure noted by Glassnode suggests decreasing distribution pressure from long-term holders, a bullish signal for the 5-year horizon. For retail traders, the mixed derivatives signals create potential for both Gamma Squeeze scenarios if volatility expands and liquidity traps if range-bound conditions persist. The stability in on-chain activity indicates neither panic selling nor FOMO buying is dominating the market, creating conditions for sustainable price discovery.
Market analysts on X/Twitter have noted the divergence between spot market easing and derivatives uncertainty. One prominent quant observed, "The drop in funding rates alongside increased open interest suggests sophisticated positioning rather than retail capitulation." Another analyst highlighted the importance of monitoring Order Block formations around the $90,000 level, stating, "If this liquidity zone holds, we're looking at a classic accumulation pattern before the next leg up." The general consensus among technical traders is that Bitcoin needs to reclaim $95,500 to invalidate the current bearish structure.
Bullish Case: If Bitcoin maintains above the $90,800 support and U.S. spot ETF inflows accelerate, a retest of $98,000 becomes probable within 2-3 weeks. The improving market structure noted by Glassnode could catalyze a breakout above $100,000 if derivatives positioning shifts to net long. Bullish Invalidation Level: A sustained break below $88,500 (0.786 Fibonacci) would indicate failed consolidation and potential retest of $85,000.
Bearish Case: If selling pressure resumes and the derivatives market shows increasing short interest, Bitcoin could test the $87,500 200-day moving average support. A break below this level would open the path to $82,000, where significant liquidity resides. Bearish Invalidation Level: A decisive close above $96,200 with expanding volume would negate the current consolidation thesis and signal resumption of the uptrend.
Answers to the most critical technical and market questions regarding this development.

Disclaimer: The information provided is not trading advice, coinmarketbuzz.com holds no liability for any investments made based on the information provided on this page. We strongly recommend independent research and/or consultation with a qualified professional before making any investment decisions.
coinmarketbuzz.com leverages advanced AI technology to analyze market data. All content is fact-checked and reviewed by our editorial team to ensure accuracy and neutrality.