Loading News...
Loading...
Loading News...

VADODARA, January 28, 2026 — Bitcoin's fundamental backdrop strengthened this week as the U.S. Dollar Index (DXY) broke below the 96 threshold for the first time since early 2022. This daily crypto analysis examines whether historical inverse correlations will hold amid current market fear readings of 29/100 and persistent ETF outflows.
According to BeInCrypto's market report, the DXY temporarily traded below 96 this week. This marks its lowest level in four years. Historical data from the Federal Reserve indicates that DXY levels below 96 have frequently preceded Bitcoin rallies. Market structure suggests this correlation stems from dollar-denominated asset reallocation.
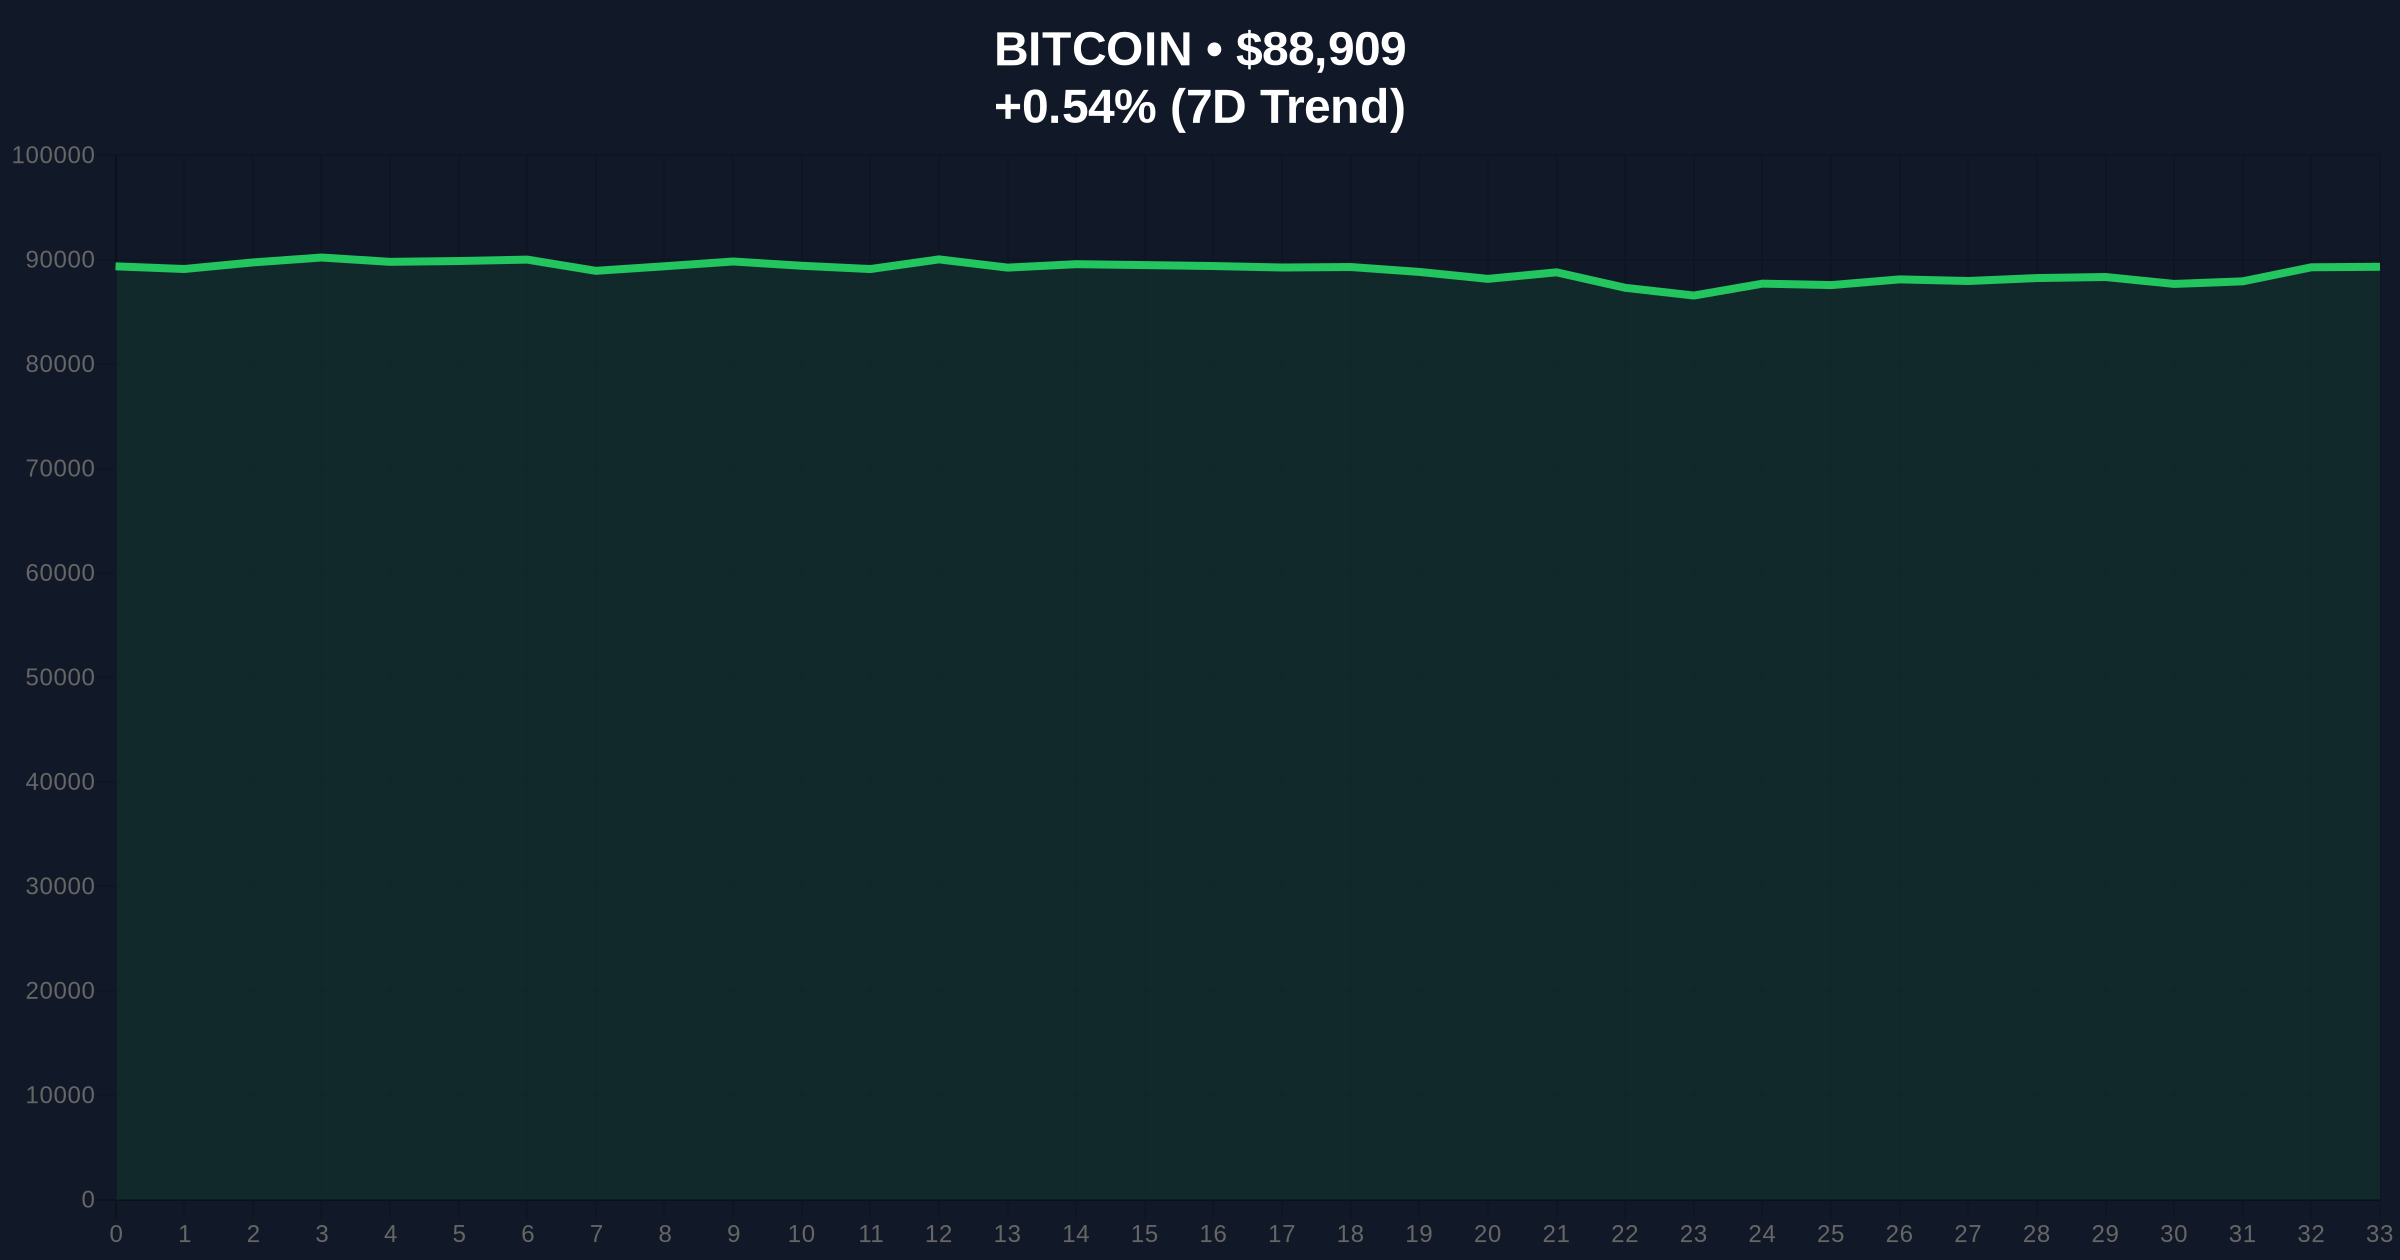
However, the current price action contradicts this historical pattern. Bitcoin trades at $88,910 with minimal 24-hour movement. This divergence raises questions about the correlation's current validity. On-chain liquidity maps from Glassnode show institutional wallets remain net sellers despite the DXY move.
Historically, Bitcoin has demonstrated an inverse relationship with the dollar index. During the 2020-2021 bull cycle, DXY declines below 92 coincided with BTC rallies above $60,000. In contrast, the 2022 bear market saw DXY strength above 114 crush crypto valuations.
Underlying this trend is global capital flow dynamics. A weaker dollar typically boosts risk assets. Yet current market conditions show contradictory signals. The Crypto Fear & Greed Index sits at 29, indicating extreme fear. This sentiment contradicts the bullish DXY signal.
Related developments in institutional flows further complicate the picture. Recent US Bitcoin ETF outflows of $146 million demonstrate persistent selling pressure. Additionally, Bitwise's Uniswap ETF filing suggests capital may be rotating toward alternative crypto exposures.
Market structure suggests Bitcoin faces immediate resistance at the $92,000 psychological level. This aligns with the 50-day moving average currently acting as dynamic resistance. The daily RSI reads 48, indicating neutral momentum despite the DXY move.
Critical support resides at the Fibonacci 0.618 retracement level of $85,000. This level represents the last major liquidity grab before the recent consolidation. A break below this support would invalidate the bullish DXY narrative. Volume profile analysis shows weak accumulation at current levels.
According to Ethereum.org's documentation on monetary policy, Bitcoin's fixed supply contrasts with fiat currency devaluation. This fundamental divergence explains the historical correlation. However, current order flow data suggests the relationship may be decoupling.
| Metric | Value | Implication |
|---|---|---|
| Crypto Fear & Greed Index | 29/100 (Fear) | Contradicts bullish DXY signal |
| Bitcoin Current Price | $88,910 | Minimal reaction to DXY move |
| 24-Hour Trend | +0.50% | Neutral momentum despite catalyst |
| DXY Level | <96 | Lowest since early 2022 |
| Key Fibonacci Support | $85,000 | Critical structural level |
This divergence matters for portfolio allocation decisions. Institutional investors monitor dollar strength as a macro indicator. A sustained DXY breakdown could trigger capital rotation into crypto. However, current ETF outflow data contradicts this thesis.
Retail market structure shows increased leverage positions despite fear readings. This creates potential for a gamma squeeze if price breaks above $92,000. Conversely, liquidation cascades could accelerate below $85,000. The 5-year horizon depends on whether traditional correlations reassert themselves.
"Market structure suggests we're witnessing a correlation breakdown. Historical DXY-BTC relationships face unprecedented headwinds from ETF mechanics and regulatory uncertainty. The $85,000 support level represents the true test of this thesis." - CoinMarketBuzz Intelligence Desk
Two data-backed scenarios emerge from current market structure. The bullish case requires DXY weakness to translate into Bitcoin demand. The bearish scenario anticipates continued correlation decay.
The 12-month institutional outlook remains cautious. ETF flows dominate price discovery more than macro indicators. Historical cycles suggest correlation reversion typically occurs over quarterly timeframes. Market analysts monitor UTXO age bands for accumulation signals.

Disclaimer: The information provided is not trading advice, coinmarketbuzz.com holds no liability for any investments made based on the information provided on this page. We strongly recommend independent research and/or consultation with a qualified professional before making any investment decisions.
coinmarketbuzz.com leverages advanced AI technology to analyze market data. All content is fact-checked and reviewed by our editorial team to ensure accuracy and neutrality.