Loading News...
Loading...
Loading News...

VADODARA, January 16, 2026 — The aggregate 24-hour long/short ratio for Bitcoin perpetual futures across the top three crypto futures exchanges by open interest stands at 50.34% long to 49.66% short, according to data from Coinness. This daily crypto analysis reveals a market structure approaching equilibrium, with individual exchange breakdowns showing Binance at 50.59% long, OKX at 50.17% long, and Bybit at 50.53% long. Market structure suggests this near-parity reflects institutional indecision as Bitcoin tests critical support at $95,602, down 0.85% in 24 hours.
Similar to the 2021 correction where futures positioning preceded a liquidity grab, current ratios mirror periods of consolidation before volatility expansion. Historical cycles suggest that when long/short ratios converge near 50%, it often precedes a directional move driven by spot market flows or macroeconomic catalysts. The current environment is characterized by post-merge issuance dynamics and regulatory scrutiny, with recent developments like Coinone's investment warnings highlighting liquidity risks in altcoins. According to on-chain data, this equilibrium contrasts with earlier 2025 extremes where ratios exceeded 60% long, indicating reduced speculative leverage and potential for a gamma squeeze if volatility spikes.
On January 16, 2026, Coinness reported that the aggregate long/short ratio for Bitcoin perpetual futures across Binance, OKX, and Bybit—the top three exchanges by open interest—is 50.34% long to 49.66% short. The individual breakdown shows minimal variance: Binance at 50.59% long/49.41% short, OKX at 50.17% long/49.83% short, and Bybit at 50.53% long/49.47% short. This data, sourced from exchange APIs and aggregated by Coinness, indicates a balanced derivatives positioning with no dominant bias, occurring as Bitcoin price hovers around $95,602. Market analysts attribute this to cautious sentiment amid testing of the $95,000 support level, a key psychological and technical zone.
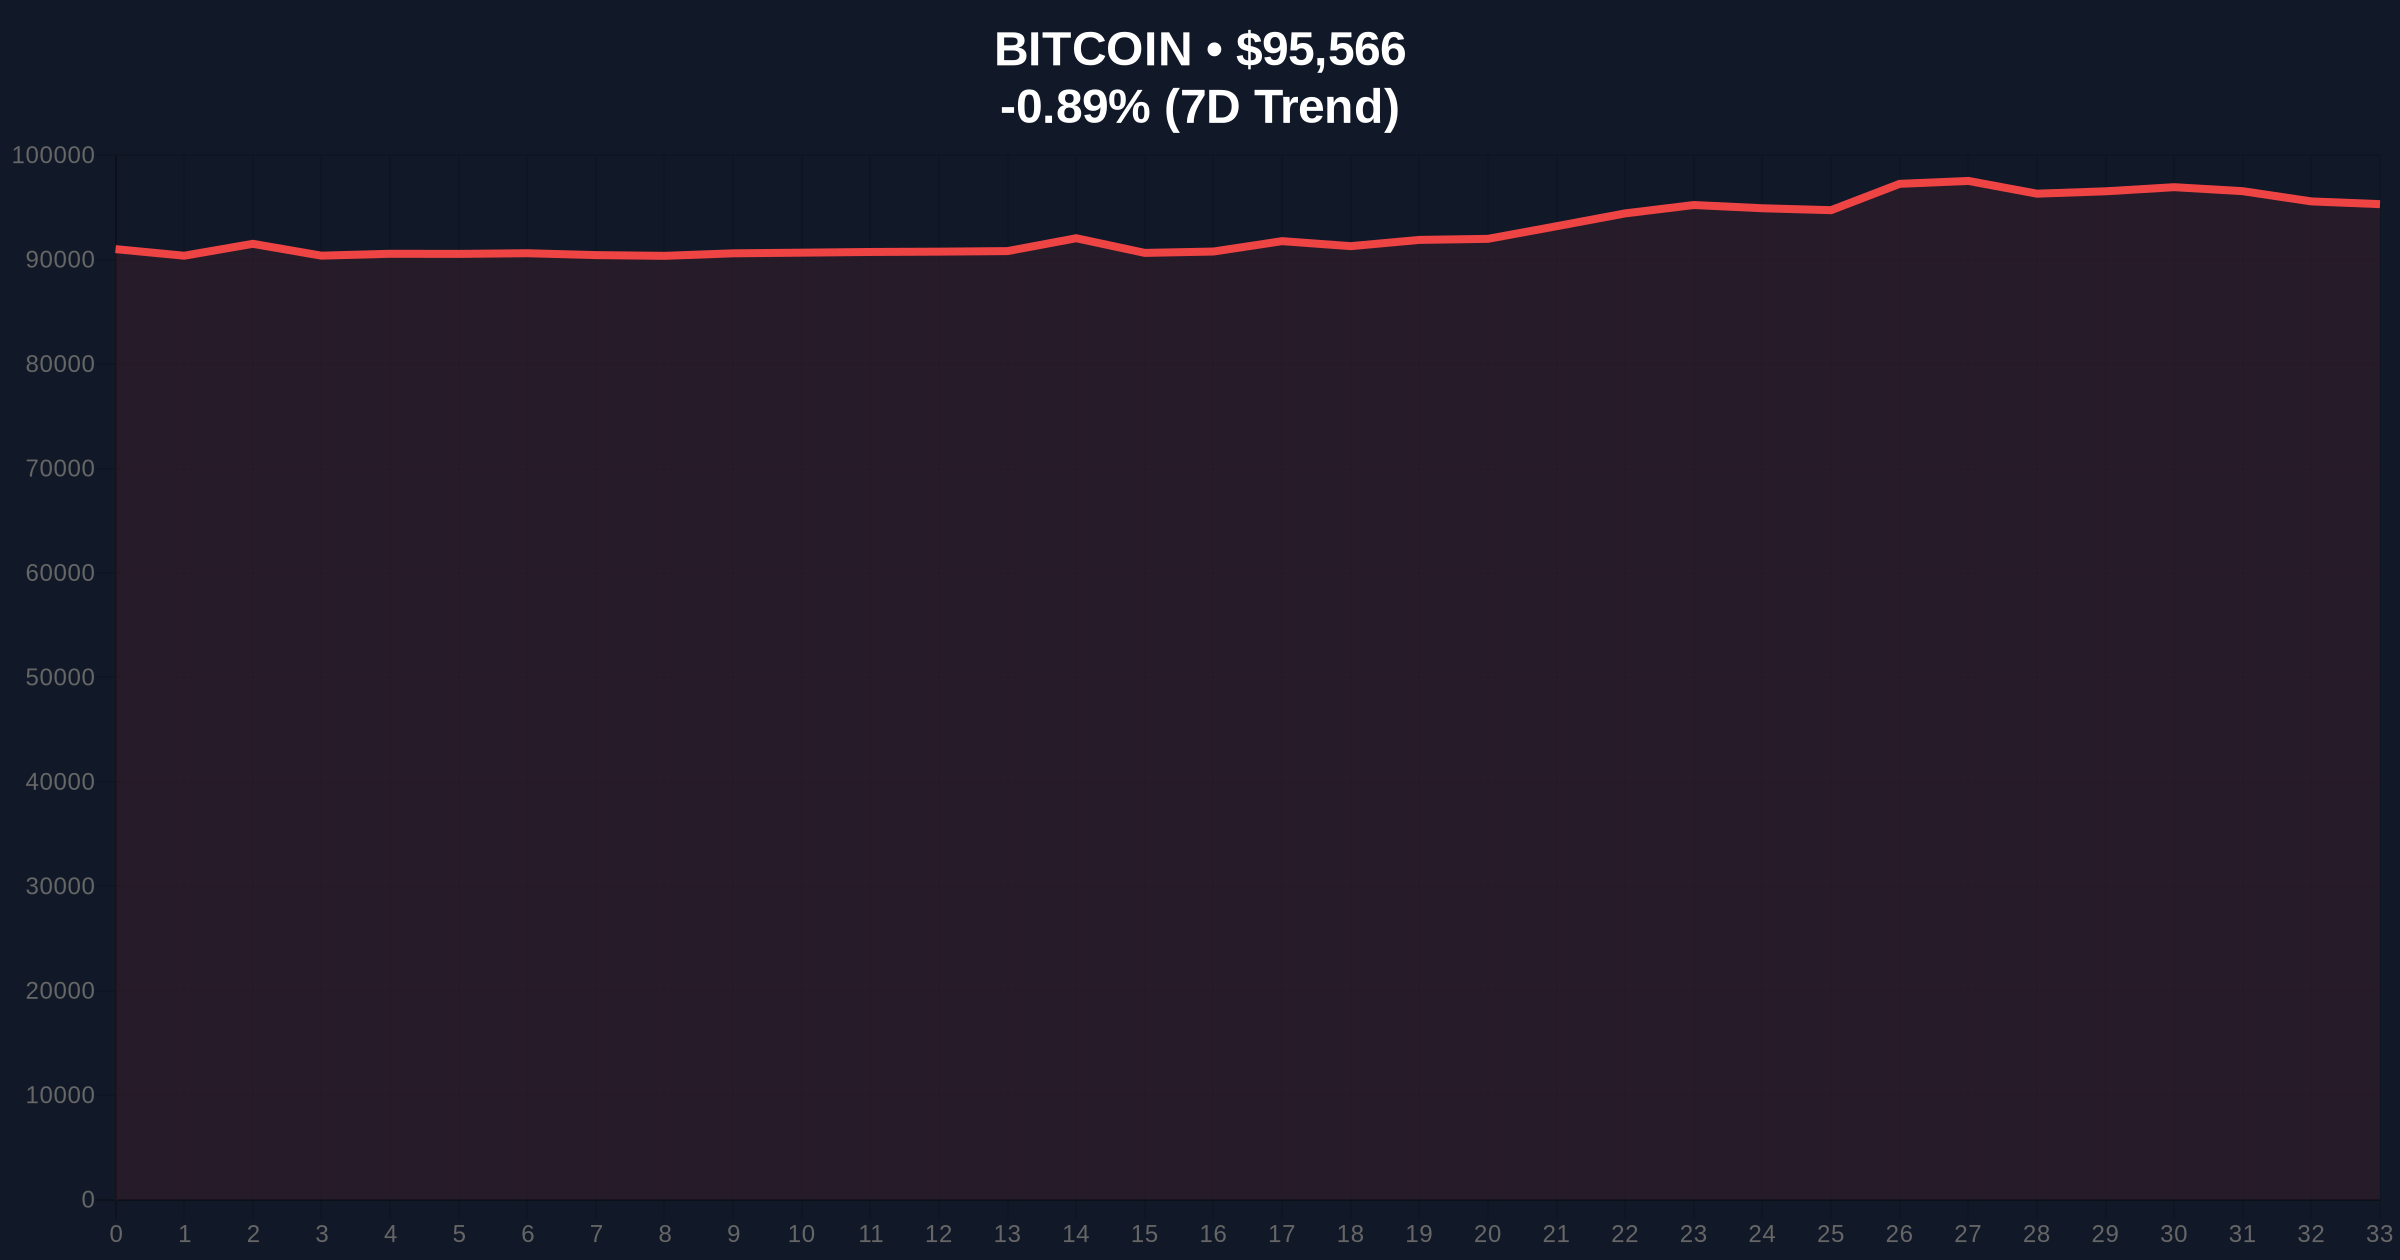
Bitcoin is currently trading at $95,602, with a 24-hour decline of 0.85%. The Relative Strength Index (RSI) on daily charts sits at 52, indicating neutral momentum, while the 50-day moving average provides dynamic support near $94,500. Volume profile analysis shows increased activity around the $95,000 level, suggesting a potential order block. A Fair Value Gap (FVG) exists between $94,200 and $95,800, which may act as a liquidity pool. Bullish Invalidation is set at $94,200—a break below this level could trigger stop-losses and a bearish trend. Bearish Invalidation is at $97,000—a sustained move above may invalidate short positions and target higher resistances. Market structure suggests that without a catalyst, price may consolidate within this range, similar to patterns observed during the 2023 sideways action.
| Metric | Value |
|---|---|
| Bitcoin Current Price | $95,602 |
| 24-Hour Price Change | -0.85% |
| Crypto Fear & Greed Index | 49/100 (Neutral) |
| Aggregate Long/Short Ratio | 50.34% long / 49.66% short |
| Binance Long/Short Ratio | 50.59% long / 49.41% short |
| OKX Long/Short Ratio | 50.17% long / 49.83% short |
| Bybit Long/Short Ratio | 50.53% long / 49.47% short |
For institutional traders, the near-equilibrium ratio reduces directional bias but increases sensitivity to liquidity grabs at key levels, as seen in recent whale movements. Retail impact is muted, as small traders often follow derivatives trends; however, a breakout from this balance could amplify volatility. On-chain data indicates that such ratios often precede significant moves, with historical precedent from the 2021 bull run where similar consolidation led to a 20% surge. The Federal Reserve's monetary policy, as detailed on FederalReserve.gov, remains a key external catalyst, influencing risk asset correlations.
Market analysts on X/Twitter note the ratio's neutrality, with some highlighting parallels to mid-2024 when balanced futures preceded a rally. Bulls argue that low leverage reduces systemic risk, while bears point to potential downside if support breaks. Sentiment is cautious, with no dominant narrative emerging, reflecting the indecision captured by the Fear & Greed Index score of 49.
Bullish Case: If Bitcoin holds above the $94,200 Bullish Invalidation level and breaks $97,000, a move toward $100,000 is plausible, driven by spot accumulation and positive macroeconomic data. Historical patterns indicate that equilibrium ratios can resolve upward if on-chain metrics like UTXO age support accumulation.
Bearish Case: A break below $94,200 could trigger a liquidity grab, targeting the next support at $92,000 (Fibonacci 0.618 retracement from recent highs). This scenario may unfold if regulatory pressures intensify or correlation with traditional markets spikes, as noted in Cathie Wood's analysis.
Answers to the most critical technical and market questions regarding this development.

Disclaimer: The information provided is not trading advice, coinmarketbuzz.com holds no liability for any investments made based on the information provided on this page. We strongly recommend independent research and/or consultation with a qualified professional before making any investment decisions.
coinmarketbuzz.com leverages advanced AI technology to analyze market data. All content is fact-checked and reviewed by our editorial team to ensure accuracy and neutrality.