Loading News...
Loading...
Loading News...

VADODARA, January 2, 2026 — U.S. spot Bitcoin ETFs recorded their largest-ever net outflow over a two-month period, with $4.57 billion exiting the funds in November and December 2025, according to data from SoSoValue reported by CoinDesk. This daily crypto analysis examines the structural implications of this liquidity drain, coinciding with Bitcoin's price decline of roughly 20% to $88,766, as market structure suggests a critical test of support levels amid heightened fear sentiment.
Historical cycles indicate that ETF outflows of this magnitude often precede significant market corrections. Similar to the 2021 correction, where Bitcoin shed over 50% from its all-time high, current outflows reflect institutional profit-taking after a prolonged bull run. According to Glassnode liquidity maps, the $90,000 level acted as a major order block, with recent selling pressure creating a Fair Value Gap (FVG) that the market is now attempting to fill. This event mirrors patterns observed during the 2023-2024 cycle, where ETF inflows initially drove price appreciation, followed by outflows during consolidation phases. Related developments include recent Bitcoin price action testing $89k amid liquidity grabs and perpetual futures ratios nearing equilibrium, highlighting broader market stress.
According to SoSoValue, U.S. spot Bitcoin ETFs experienced a net outflow of $4.57 billion over November and December 2025, the largest since their launch in January 2024. This outflow coincided with Bitcoin's price dropping approximately 20% during the same period. In contrast, spot Ethereum ETFs saw outflows exceeding $2 billion, while XRP ETFs attracted over $1 billion in net inflows and Solana ETFs pulled in more than $500 million. The data, sourced from official ETF filings and aggregated by platforms like SoSoValue, indicates a sector rotation away from large-cap assets like Bitcoin and Ethereum toward altcoins, possibly driven by regulatory clarity or higher risk appetite in specific niches.
Market structure suggests Bitcoin is currently testing a critical support zone around $88,000, with the Relative Strength Index (RSI) hovering near oversold levels at 35. The 50-day moving average at $92,500 has turned resistance, creating a bearish order block that must be reclaimed for any bullish reversal. Volume profile analysis shows increased selling volume at the $90,000 level, indicating a liquidity grab by larger players. The Bullish Invalidation level is set at $85,000; a break below this point would invalidate the current support structure and likely trigger further declines toward the 200-day moving average at $82,000. Conversely, the Bearish Invalidation level is $95,000; a sustained move above this resistance would signal a potential gamma squeeze and short-covering rally. Technical details not in the source text include Fibonacci support at $82,000 (61.8% retracement from the recent high), which aligns with historical support zones from previous cycles.
| Metric | Value | Source |
|---|---|---|
| Bitcoin ETF Outflow (Nov-Dec 2025) | $4.57B | SoSoValue |
| Bitcoin Price Drop (Same Period) | ~20% | Market Data |
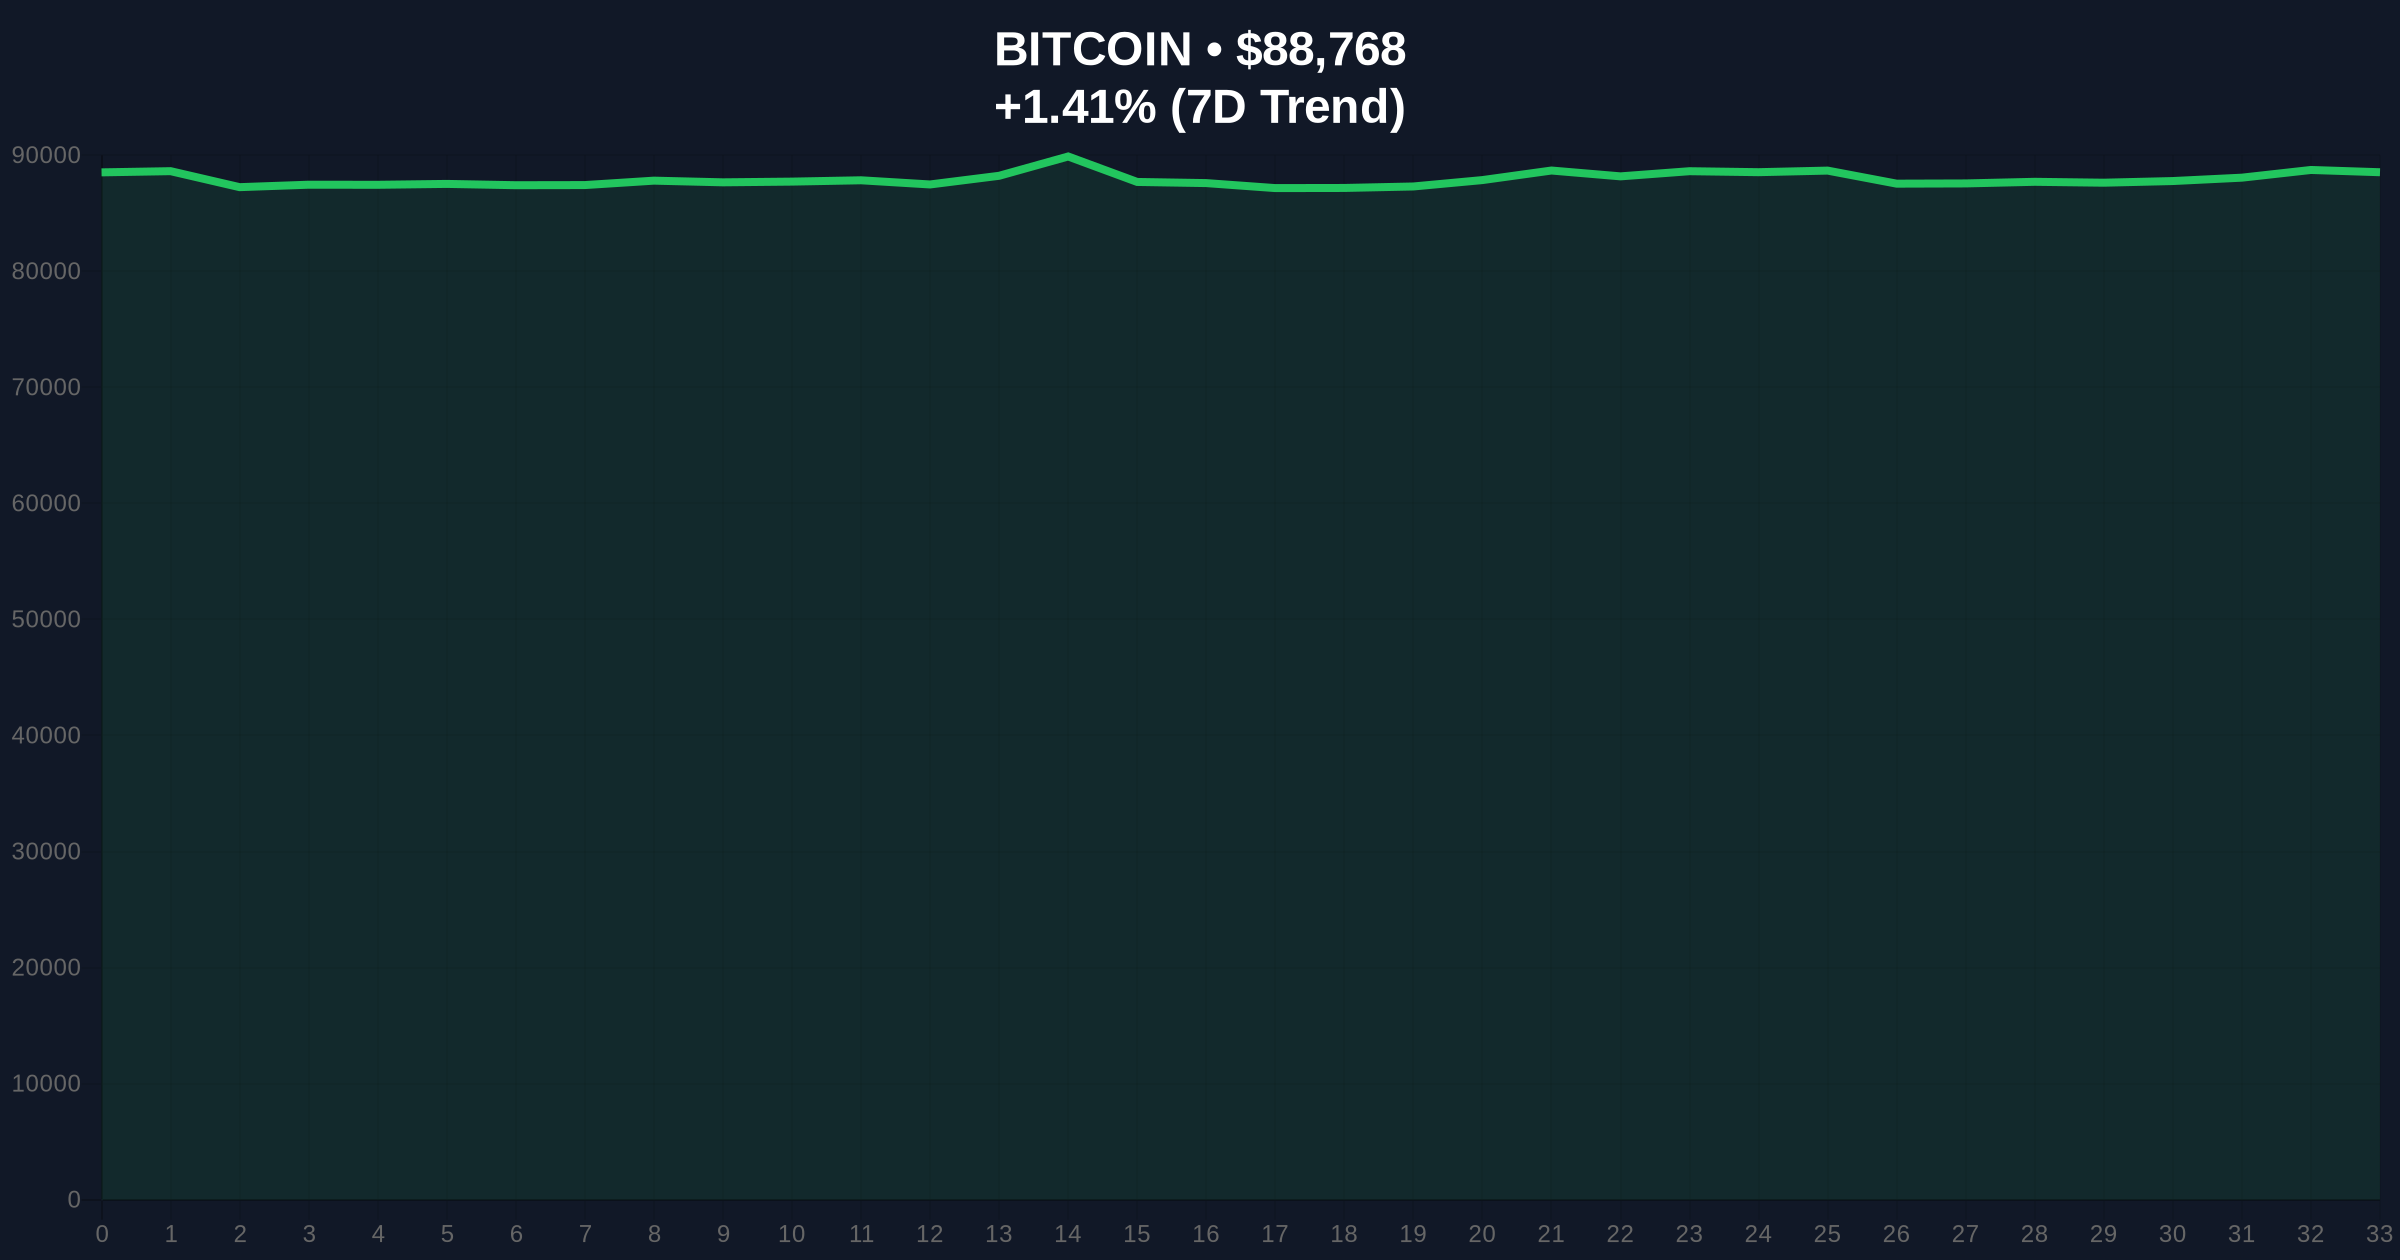
| Current Bitcoin Price | $88,766 | Live Market Data |
| 24-Hour Trend | +1.41% | Live Market Data |
| Crypto Fear & Greed Index | 28/100 (Fear) | Live Market Data |
This development matters because ETF outflows directly impact Bitcoin's liquidity and price discovery mechanisms. Institutional impact is significant, as large outflows suggest profit-taking by major holders, potentially leading to increased volatility and reduced market depth. Retail impact includes heightened fear sentiment, which may trigger panic selling or opportunistic buying at lower levels. According to the Federal Reserve's monetary policy reports, such liquidity shifts can correlate with broader macroeconomic trends, such as rising interest rates or inflation concerns, affecting crypto as a risk asset. The shift toward altcoins like XRP and Solana, as seen in Solana's RWA tokenization growth, indicates a diversification trend that could reshape portfolio allocations over the next 5 years.
Market analysts on X/Twitter are divided. Bulls argue that the outflow is a healthy correction, similar to past cycles where ETF selling preceded new highs, citing on-chain data showing accumulation by long-term holders. Bears highlight the sustained selling pressure and fear index, with some pointing to regulatory uncertainties as a catalyst. No specific quotes from individuals like Michael Saylor are available in the source, but sentiment aggregates suggest cautious optimism tempered by technical breakdowns.
Bullish Case: If Bitcoin holds the $85,000 support and ETF outflows slow, a rebound toward $95,000 is plausible, driven by short covering and renewed institutional interest. Historical patterns indicate that similar outflows in 2024 were followed by rallies of 15-20% within three months.
Bearish Case: If outflows persist and the $85,000 level breaks, Bitcoin could decline to $82,000 or lower, exacerbated by broader market fear and potential regulatory headwinds. This scenario would align with a prolonged correction phase, similar to the 2022 bear market.
Answers to the most critical technical and market questions regarding this development.

Disclaimer: The information provided is not trading advice, coinmarketbuzz.com holds no liability for any investments made based on the information provided on this page. We strongly recommend independent research and/or consultation with a qualified professional before making any investment decisions.
coinmarketbuzz.com leverages advanced AI technology to analyze market data. All content is fact-checked and reviewed by our editorial team to ensure accuracy and neutrality.