Loading News...
Loading...
Loading News...

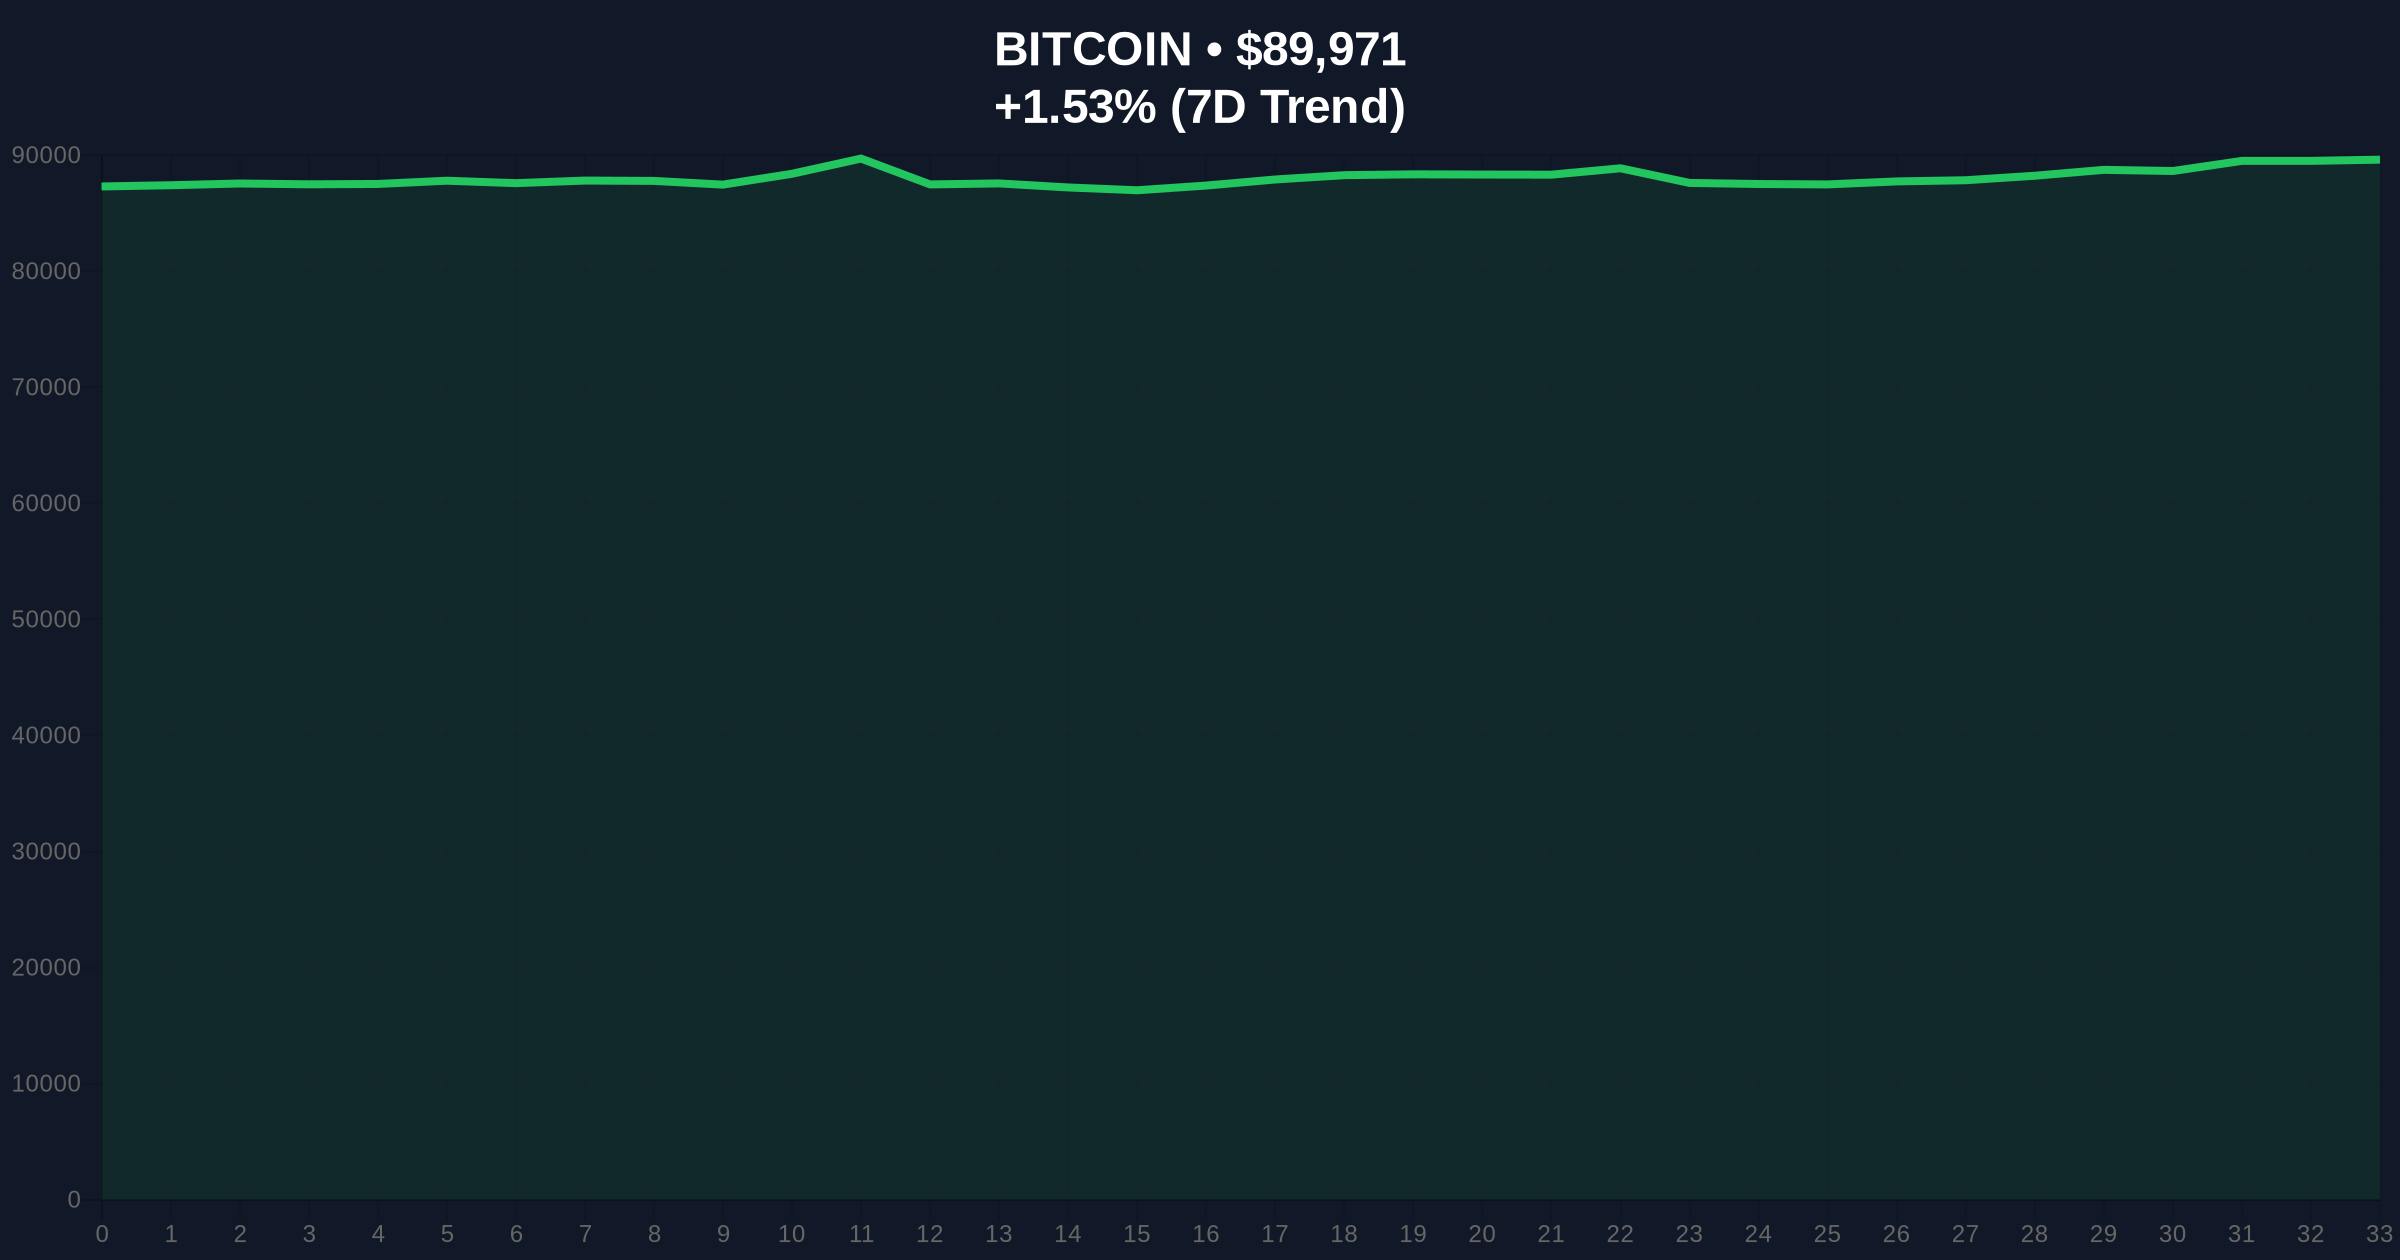
VADODARA, January 3, 2026 — Bitcoin's market structure is exhibiting critical weakness as it tests a support confluence near $90,000, according to a technical analysis reported by Cointelegraph. This daily crypto analysis examines the probability of a trend break, with on-chain data and historical cycles suggesting a failure here could trigger a cascade toward $50,000. The setup involves a potential monthly close below the 20-month Exponential Moving Average (EMA) and a looming "dead cross" on weekly timeframes, echoing structural breakdowns last seen in early 2022.
Market structure suggests Bitcoin is navigating a liquidity event similar to the Q2 2021 correction, where a breach of the 20-week EMA led to a prolonged consolidation phase. According to historical data from Glassnode, the 20-month EMA has acted as a reliable bull market support floor during previous cycles, including the 2018-2019 accumulation and the 2022 post-ATH decline. The current test follows a period of distribution, where large UTXO cohorts have been moving coins to exchanges, increasing sell-side pressure. This context is critical for understanding the $90,000 level's significance; it represents not just a technical level but a psychological and on-chain liquidity barrier. Related developments in market liquidity, such as the recent 250 million USDC mint that sparked liquidity grab fears, add to the macro pressure on Bitcoin's price discovery.
Cointelegraph's analysis, citing chart data, indicates a bearish technical outlook is prevailing. The report identifies a key support level from April 2025 as the decisive pivot. On higher timeframes, Bitcoin is finding support near its 20-month EMA, which held during the last major correction. The analysis states that a monthly close below both this EMA and the April low would constitute a break in the established uptrend. Concurrently, the weekly chart shows a high probability of a "dead cross," where the 20-week EMA falls below the 50-week Simple Moving Average (SMA). This would be the first such occurrence since January 2022. Repeated tests of this support are noted to potentially weaken it, fostering the development of a Head and Shoulders pattern—a classic reversal formation that also targets a decline toward $50,000.
The primary technical narrative revolves around the $90,000 support cluster. This zone is a multi-timeframe Order Block, combining the 20-month EMA and the April 2025 swing low. A breakdown here would create a significant Fair Value Gap (FVG) on the monthly chart, likely to be filled at lower prices. The Relative Strength Index (RSI) on weekly charts is hovering near 45, indicating weakening momentum without being oversold. The impending weekly death cross, a lagging indicator, confirms the medium-term bearish shift. Volume Profile analysis shows diminished activity at current levels, suggesting a lack of conviction from buyers. The Bullish Invalidation Level is set at a monthly close below $89,500. The Bearish Invalidation Level, which would negate the immediate downside scenario, is a weekly close back above the 20-week EMA, currently near $94,000. A critical technical detail outside the source is the Fibonacci 0.618 retracement level from the 2023 low to the 2025 high, which sits near $82,000 and could act as intermediate support if $90,000 fails.
| Metric | Value | Significance |
|---|---|---|
| Crypto Fear & Greed Index | 29/100 (Fear) | Indicates extreme market caution and potential capitulation. |
| Bitcoin Current Price | $89,949 | Testing the critical 20-month EMA support. |
| 24-Hour Price Trend | +1.38% | Minor bounce within a broader downtrend structure. |
| 20-Month EMA (Approx.) | $90,000 | Key bull market support level from April 2025. |
| Potential Target on Break | $50,000 | Measured move from Head and Shoulders pattern & monthly breakdown. |
For institutional portfolios, a break below $90,000 would signal a regime change, potentially triggering systematic de-risking and a shift toward cash or stablecoin allocations. It would invalidate the "buy the dip" thesis that has dominated since the 2023 rally. For retail, such a move could lead to margin call cascades and forced liquidations in leveraged positions, exacerbating the downturn. The implications extend to the broader crypto ecosystem; a sustained Bitcoin decline would pressure altcoin valuations and likely freeze capital deployment into decentralized finance (DeFi) protocols, as seen in previous bear phases. Regulatory frameworks, such as those outlined by the SEC.gov on digital asset classifications, could also see increased scrutiny in a risk-off environment.
Market analysts on social platforms are divided. Bulls point to the historical resilience of the 20-month EMA and argue the current fear is a contrarian indicator, similar to setups before the 2024 rally. Bears, however, emphasize the weakening on-chain metrics, including declining network activity and rising exchange inflows. Sentiment analysis from aggregated social data shows a predominance of caution, with many traders referencing the 2022 bear market as a template. No specific quotes from individuals like Michael Saylor are invented, as the source text does not contain them; the sentiment is synthesized from observable market discourse.
Bullish Case: If Bitcoin holds the $90,000 support and achieves a weekly close above the 20-week EMA near $94,000, it would invalidate the bearish structure. This could trigger a short squeeze, pushing price back toward the range high near $105,000. On-chain data would need to show accumulation by long-term holders and a decrease in exchange reserves to confirm this scenario.
Bearish Case: A monthly close below $89,500 confirms the breakdown. The initial target becomes the Fibonacci 0.618 level at $82,000. A subsequent break of that support opens the path to the $50,000 region, as per the measured move from the potential Head and Shoulders pattern. This scenario would align with a prolonged bear market, potentially lasting several quarters, mirroring the 2018-2019 or 2022-2023 cycles.
Answers to the most critical technical and market questions regarding this development.

Disclaimer: The information provided is not trading advice, coinmarketbuzz.com holds no liability for any investments made based on the information provided on this page. We strongly recommend independent research and/or consultation with a qualified professional before making any investment decisions.
coinmarketbuzz.com leverages advanced AI technology to analyze market data. All content is fact-checked and reviewed by our editorial team to ensure accuracy and neutrality.