Loading News...
Loading...
Loading News...

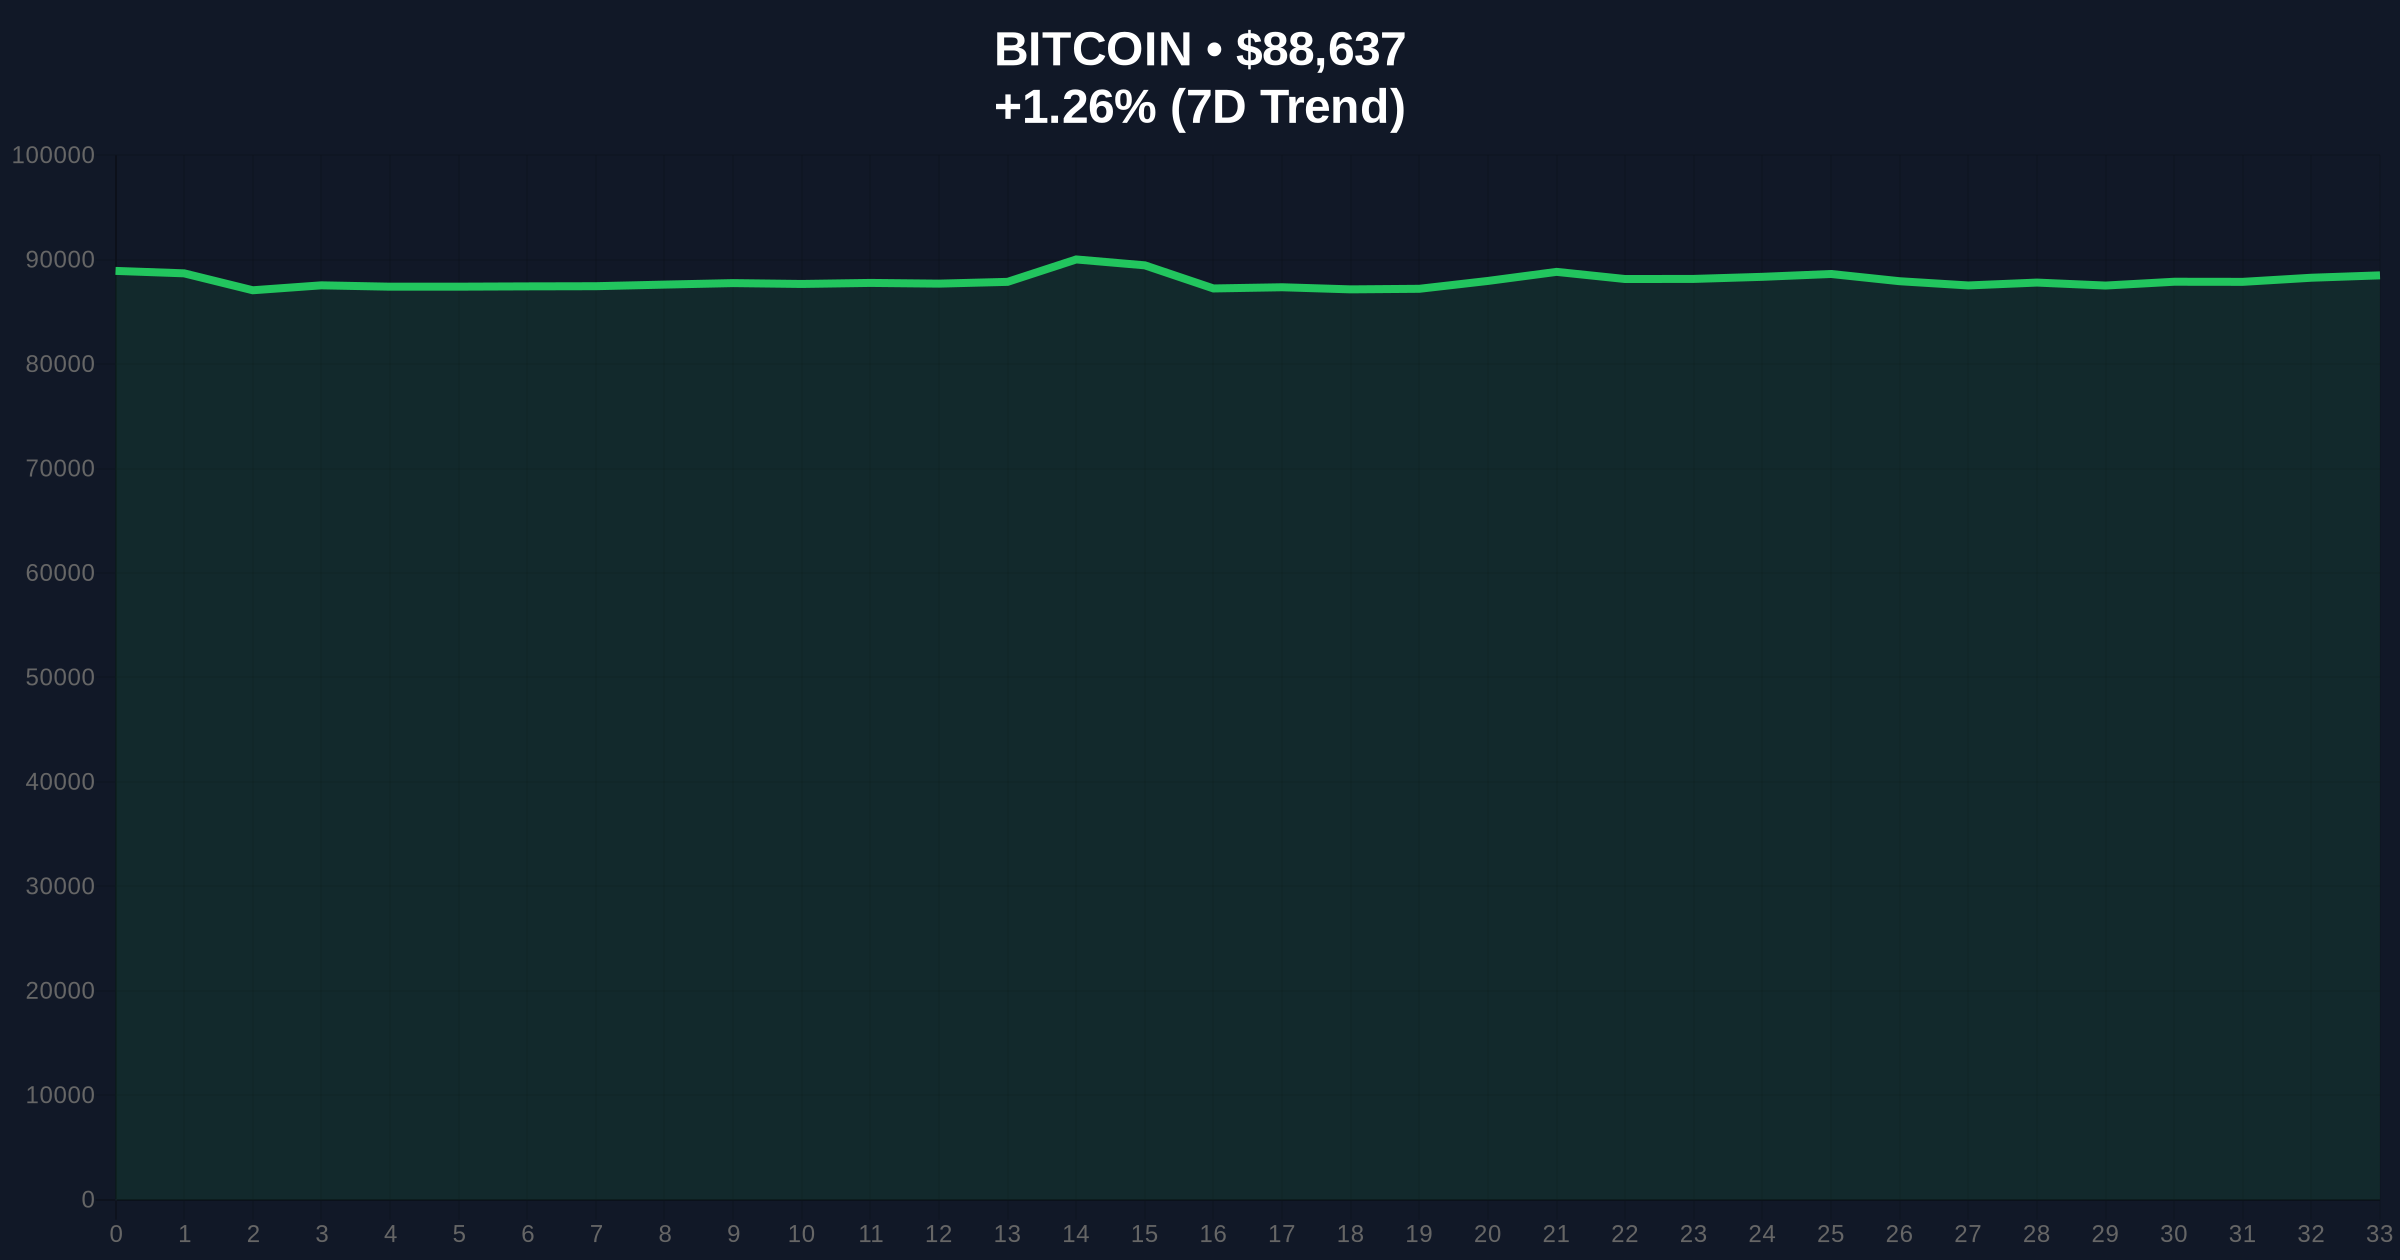
VADODARA, January 2, 2026 — Bitcoin perpetual futures long/short ratios across major exchanges have converged toward equilibrium, with aggregate positions showing 49.29% long versus 50.71% short, according to data from Coinness. This daily crypto analysis reveals a market structure reminiscent of the 2021 correction, where similar ratio compression preceded significant volatility. The current price of $88,634 is testing a critical Fibonacci support level at $88,000, while the Crypto Fear & Greed Index registers a score of 28, indicating extreme fear.
Market structure suggests this ratio compression mirrors patterns observed during the 2021 Bitcoin correction, when perpetual futures long/short ratios approached 50/50 before a liquidity grab triggered a 30% drawdown. According to historical cycles, equilibrium in futures positioning often precedes directional breaks as market makers hunt for stop-loss orders. The current environment is characterized by high open interest on derivatives exchanges, creating conditions for a potential gamma squeeze if volatility spikes. Similar to the 2021 scenario, on-chain data indicates accumulation by long-term holders near these levels, but derivatives sentiment remains fragile.
Related developments include recent Bitcoin price action testing $89k amid liquidity concerns and a Bloomberg strategist warning of a deeper correction below $88k, highlighting the critical nature of current support levels.
According to Coinness, the 24-hour long/short ratios for Bitcoin perpetual futures on the top three exchanges by open interest are as follows: Binance at 49.3% long / 50.7% short, OKX at 49.64% long / 50.36% short, and Bybit at 51.02% long / 48.98% short. The aggregate ratio stands at 49.29% long versus 50.71% short. This data, sourced from exchange APIs, shows a near-perfect equilibrium, with Bybit exhibiting a slight long bias. Market analysts note that such tight ratios often indicate indecision before a volatility expansion, as seen in previous cycles where post-merge issuance adjustments influenced derivatives flows.
Price action is currently testing the $88,000 support level, which aligns with the 0.618 Fibonacci retracement from the recent all-time high. The Relative Strength Index (RSI) on daily charts is at 42, suggesting neutral momentum but with bearish divergence on lower timeframes. A Fair Value Gap (FVG) exists between $89,500 and $90,200, which may act as a magnet for price if bullish momentum resumes. The 50-day moving average at $90,500 provides dynamic resistance, while volume profile analysis shows high node concentration at $87,000, indicating a potential Order Block for institutional buyers.
Bullish Invalidation Level: A daily close below $87,000 would invalidate the current support structure, targeting $85,000.
Bearish Invalidation Level: A break above $91,000 would negate the bearish scenario, opening a path to $93,500.
| Metric | Value |
|---|---|
| Crypto Fear & Greed Index | 28 (Fear) |
| Bitcoin Current Price | $88,634 |
| 24-Hour Price Change | +1.22% |
| Aggregate Long/Short Ratio | 49.29% long / 50.71% short |
| Bybit Long/Short Ratio | 51.02% long / 48.98% short |
For institutional investors, this ratio equilibrium signals reduced directional bias in derivatives markets, potentially leading to decreased hedging costs but increased tail risk. Retail traders face heightened volatility as liquidity grabs become more likely near key support levels. The convergence of ratios across exchanges suggests synchronized market behavior, which can amplify moves during news events or macroeconomic shifts. According to the Federal Reserve's monetary policy reports, interest rate decisions continue to influence crypto correlations, making this technical setup critical for risk management.
Market analysts on X/Twitter highlight the significance of the $88,000 support, with some noting that "ratio compression often precedes explosive moves." Others point to the Fear & Greed Index score of 28 as a contrarian indicator, suggesting potential buying opportunities if historical patterns hold. Sentiment remains divided, with bulls emphasizing accumulation by long-term holders and bears warning of further downside if macroeconomic headwinds persist.
Bullish Case: If Bitcoin holds above $88,000 and the long/short ratio shifts toward 55% long, a rally to $95,000 is plausible, driven by a short squeeze and renewed institutional inflows. This scenario would require a break of the FVG at $90,200 and sustained volume above average.
Bearish Case: A break below $87,000 could trigger a liquidation cascade, targeting $85,000 and potentially $82,000, as per the Bloomberg strategist warning. This would be exacerbated if the aggregate short ratio exceeds 55%, indicating heightened bearish conviction.
Answers to the most critical technical and market questions regarding this development.

Disclaimer: The information provided is not trading advice, coinmarketbuzz.com holds no liability for any investments made based on the information provided on this page. We strongly recommend independent research and/or consultation with a qualified professional before making any investment decisions.
coinmarketbuzz.com leverages advanced AI technology to analyze market data. All content is fact-checked and reviewed by our editorial team to ensure accuracy and neutrality.