Loading News...
Loading...
Loading News...

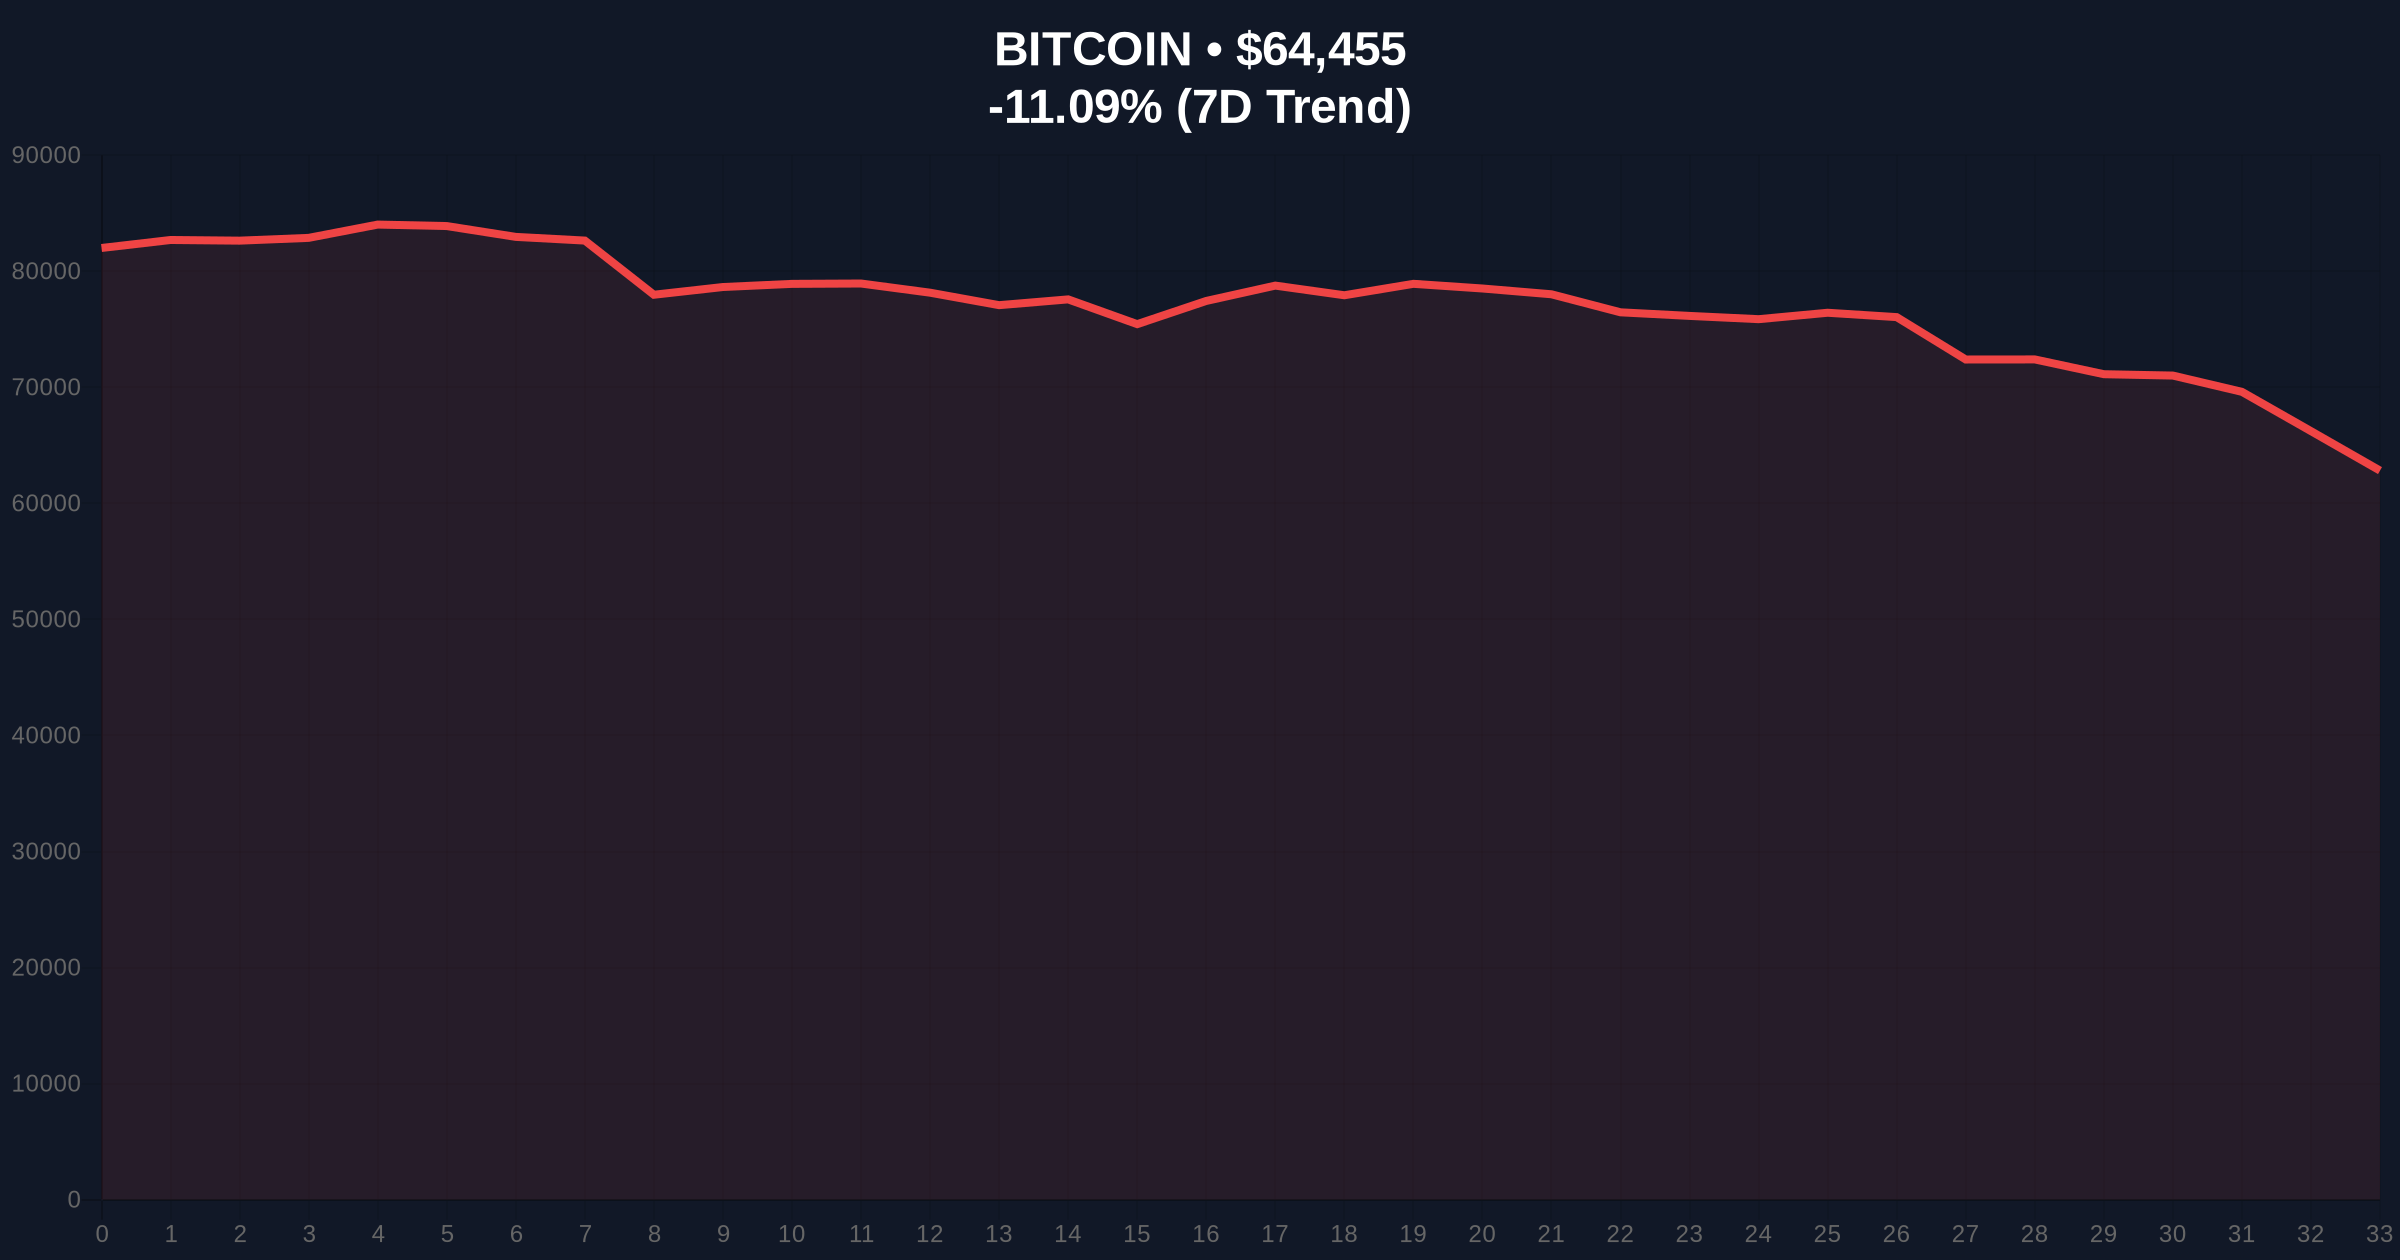
VADODARA, February 6, 2026 — Bitcoin's inability to hold critical support levels has triggered a wave of risk-off sentiment, with the capitulation indicator reaching its second-highest level in two years. This daily crypto analysis examines the confluence of excessive leverage liquidations, spot ETF outflows, and deteriorating market structure. According to Vincent Liu, CIO at Kronos Research, selling pressure has peaked, while BTC Markets analyst Rachael Lucas notes a defensive shift among traders. Market structure suggests a liquidity grab is underway, challenging the bullish narrative.
Bitcoin repeatedly failed to defend key support levels this week, according to analysts cited in The Block's market report. Vincent Liu, chief investment officer at Kronos Research, attributed the decline to three primary factors. Excessive leverage liquidations amplified downside momentum. Spot ETF and institutional fund outflows removed a key liquidity pillar. A broader risk-off trend in the macro environment exacerbated the sell-off. Liu stated the Bitcoin capitulation indicator recently hit its second-highest level in two years. This suggests selling pressure has reached a potential peak.
BTC Markets analyst Rachael Lucas provided on-the-ground trader sentiment. She noted traders are no longer attempting to catch a falling knife. Instead, they are adopting defensive positions. This behavior is supported by sell-offs during every price rebound. A sharp decline in trading volume further confirms the lack of conviction. Lucas observed that as BTC fails to defend major support lines, traders are shifting strategies. The buy-the-dip approach is being replaced by a wait-and-see stance.
Historically, capitulation indicators at such elevated levels have preceded significant trend reversals or prolonged consolidation. The current reading mirrors patterns observed during the June 2022 sell-off, which saw Bitcoin bottom near $17,600. In contrast, the 2021 cycle peak saw capitulation followed by a swift recovery, driven by relentless institutional inflows. Underlying this trend is a critical divergence: spot ETF flows, once a reliable bullish signal, have turned negative. This contradicts the post-2023 narrative of perpetual institutional demand.
Market structure analysis reveals a concerning pattern. Each failed support test creates a Fair Value Gap (FVG) on lower timeframes. These gaps act as liquidity magnets for further downside. The shift from buy-the-dip to defensive waiting suggests retail sentiment has broken. This often marks the transition from a distribution phase to a potential capitulation event. Related developments include Bitcoin's implied volatility nearing FTX collapse levels and detailed analysis of the break below $64,000.
Technical analysis indicates Bitcoin broke below the critical $65,000 support, a level that had held since early January. The current price of $64,504 sits at a 24-hour loss of -11.02%. The Relative Strength Index (RSI) on daily charts is approaching oversold territory near 25. However, oversold conditions can persist during strong downtrends. The 50-day moving average has crossed below the 200-day MA, forming a death cross on higher timeframes. This signals medium-term bearish momentum.
On-chain data from Glassnode shows a surge in UTXO (Unspent Transaction Output) age bands moving from profit to loss. This indicates long-term holders are beginning to distribute. Volume profile analysis reveals thin liquidity below $64,000, suggesting a break could trigger accelerated selling. A key Order Block exists between $62,500 and $63,200, a zone where institutional buy orders may cluster. The Fibonacci 0.618 retracement level from the 2023 low to the 2025 high sits near $61,800, providing a potential ultimate support.
| Metric | Value | Implication |
|---|---|---|
| Crypto Fear & Greed Index | 9/100 (Extreme Fear) | Peak negative sentiment, often a contrarian indicator |
| Bitcoin Current Price | $64,504 | Testing immediate support at $64,000 |
| 24-Hour Price Change | -11.02% | Sharp decline indicating strong selling pressure |
| Capitulation Indicator Level | 2nd Highest in 2 Years | Selling pressure at potential peak per Kronos Research |
| Market Rank | #1 | Dominance remains intact despite sell-off |
This support failure matters because it challenges the core institutional thesis. Spot ETF outflows contradict the narrative of steady demand from regulated products. Excessive leverage liquidations indicate systemic risk within crypto-native finance. The shift to defensive positioning reduces overall market liquidity. This creates a negative feedback loop. Lower liquidity increases volatility, which further deters participation. The breakdown also tests the resilience of Bitcoin's long-term store-of-value narrative during macro stress.
Real-world evidence includes net outflows from U.S. spot Bitcoin ETFs over the past week. Data from Fidelity and BlackRock filings show a notable reduction in holdings. Institutional liquidity cycles suggest this may be part of a larger quarter-end rebalancing. Retail market structure appears fragile, with social sentiment metrics plunging. The gamma squeeze potential from options markets has diminished, removing a potential volatility catalyst.
"The Bitcoin capitulation indicator recently hit its second-highest level in two years, which suggests that selling pressure in the market has reached its peak," said Vincent Liu, CIO at Kronos Research. This aligns with on-chain data showing a potential exhaustion of weak hands.
"Traders are no longer trying to catch a falling knife and are instead adopting defensive positions," noted Rachael Lucas, analyst at BTC Markets. This behavioral shift is critical for understanding the current phase of the market cycle.
Market structure suggests two primary scenarios based on the $64,000 support level. A hold above this level could lead to a consolidation phase between $64,000 and $68,000. This would allow leverage to reset and sentiment to stabilize. A break below triggers a test of the Order Block near $62,500. Historical cycles indicate such breaks often lead to a 15-20% decline before finding a durable bottom.
The 12-month institutional outlook hinges on macro conditions and ETF flow reversal. If the Federal Reserve signals a dovish pivot, as historical data from FederalReserve.gov often precedes, risk assets could recover. However, continued outflows would pressure Bitcoin's valuation. The 5-year horizon remains intact for Bitcoin's network security and adoption, but short-term price discovery is dominated by liquidity and sentiment.

Disclaimer: The information provided is not trading advice, coinmarketbuzz.com holds no liability for any investments made based on the information provided on this page. We strongly recommend independent research and/or consultation with a qualified professional before making any investment decisions.
coinmarketbuzz.com leverages advanced AI technology to analyze market data. All content is fact-checked and reviewed by our editorial team to ensure accuracy and neutrality.