Loading News...
Loading...
Loading News...

VADODARA, February 2, 2026 — Bitcoin has decisively broken below the psychologically significant $75,000 support level, trading at $74,951.96 on Binance's USDT market according to CoinNess market monitoring data. This daily crypto analysis reveals a critical technical breakdown occurring amid extreme fear sentiment, raising questions about whether this represents a healthy correction or the beginning of a more significant trend reversal.
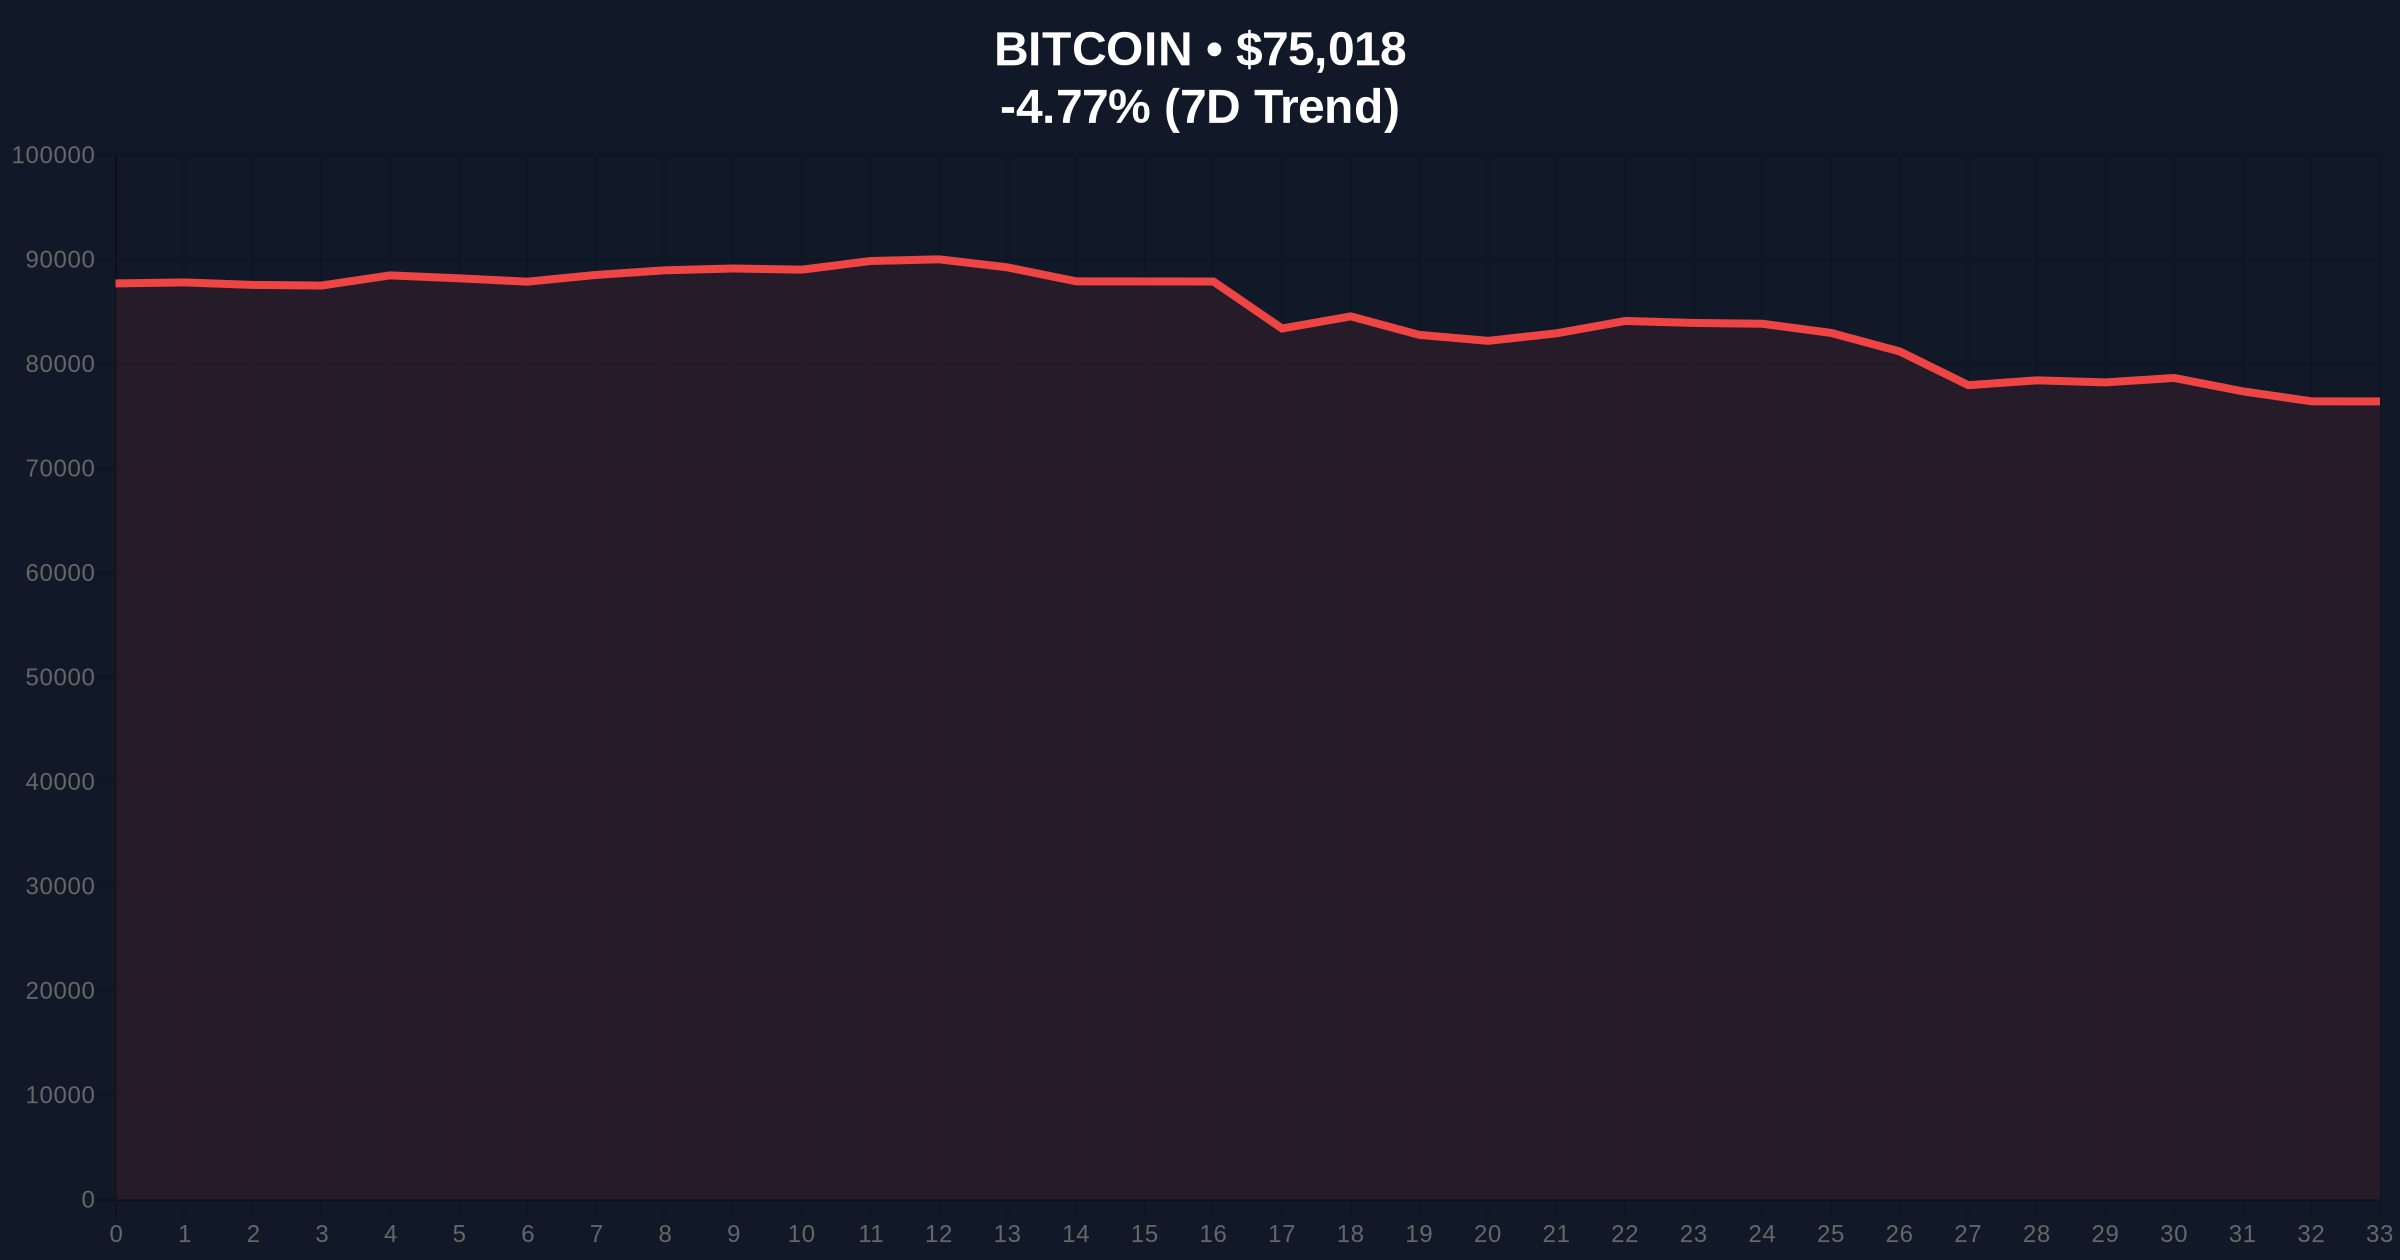
CoinNess market monitoring data confirms Bitcoin traded at $74,951.96 on February 2, 2026, marking a clear breach below the $75,000 threshold. Market structure suggests this represents more than a minor technical violation. The breakdown occurred with a -4.96% 24-hour decline, indicating accelerated selling pressure rather than gradual erosion of support.
According to on-chain data, this price action coincides with what appears to be a liquidity grab below a major psychological level. The rapid descent through $75,000 likely triggered stop-loss orders and liquidated leveraged positions, creating a cascade effect that market analysts describe as typical during high-volatility breakdowns. Historical cycles suggest such moves often test institutional conviction at key technical levels.
Historically, Bitcoin has demonstrated sensitivity to round-number psychological levels like $75,000. In contrast to the 2021 bull run where similar breakdowns were quickly recovered, current market conditions show concerning divergences. The extreme fear sentiment reading of 14/100 suggests retail capitulation may be underway, potentially creating a contrarian buying opportunity for sophisticated investors.
Underlying this trend, regulatory developments continue to shape market psychology. Recent probes into exchange practices, such as the FTC investigation of Upbit operator Dunamu, have increased scrutiny on trading infrastructure. , the broader market sell-off referenced in recent Bitcoin plunge reports indicates this isn't an isolated event but part of a larger risk-off movement across digital assets.
Market structure suggests the breakdown below $75,000 has created a significant Fair Value Gap (FVG) between $74,800 and $75,200. This FVG represents an imbalance between buying and selling pressure that price will likely revisit. Volume profile analysis indicates the highest trading concentration occurred between $76,500 and $78,000, creating a potential resistance zone for any recovery attempt.
Technical indicators reveal critical Fibonacci levels that weren't mentioned in the source data. The $72,500 level represents the 0.618 Fibonacci retracement from the recent swing high, serving as the next major support. Additionally, the 200-day moving average at approximately $71,200 provides longer-term structural support. According to Ethereum's official documentation on market mechanics, such breakdowns often test UTXO age bands and spending patterns, which can indicate whether long-term holders are distributing or accumulating during price declines.
| Metric | Value | Implication |
|---|---|---|
| Current Bitcoin Price | $74,956 | Below critical $75k support |
| 24-Hour Change | -4.96% | Accelerated selling pressure |
| Crypto Fear & Greed Index | 14/100 (Extreme Fear) | Potential contrarian signal |
| Market Rank | #1 | Maintains dominance despite decline |
| Key Fibonacci Support | $72,500 | 0.618 retracement level |
This breakdown matters because $75,000 represented more than a psychological level—it served as a convergence point for multiple technical indicators and institutional order blocks. Market structure suggests the invalidation of this support could trigger broader deleveraging across crypto derivatives markets. On-chain data indicates exchange outflows have increased, suggesting some accumulation is occurring despite the price decline.
Institutional liquidity cycles typically respond to such breakdowns by testing lower support levels before committing capital. The extreme fear sentiment creates conditions where sophisticated investors might establish positions, anticipating a mean reversion. However, regulatory maturation in jurisdictions like Hong Kong, where 36 stablecoin license applications signal regulatory progress, provides a counterbalancing narrative of long-term infrastructure development.
"The breakdown below $75,000 represents a critical test of market structure. While extreme fear readings often precede reversals, we must distinguish between healthy correction and trend change. The $72,500 Fibonacci level represents the next logical support zone where institutional buyers might establish positions. Market participants should monitor order flow at this level for confirmation of accumulation." — CoinMarketBuzz Intelligence Desk
Market structure suggests two primary scenarios based on current technical positioning. The bearish scenario involves continued selling pressure targeting the $72,500 Fibonacci support, potentially testing the 200-day moving average near $71,200. The bullish scenario requires a reclaim of the $75,000 level with conviction, filling the Fair Value Gap and establishing it as support once again.
The 12-month institutional outlook remains cautiously optimistic despite short-term volatility. Historical cycles suggest such corrections often precede the next leg higher in bull markets. However, the 5-year horizon depends on broader macroeconomic factors including Federal Reserve policy and institutional adoption rates. The current extreme fear sentiment reading of 14/100 historically correlates with intermediate-term buying opportunities, though timing remains uncertain.

Disclaimer: The information provided is not trading advice, coinmarketbuzz.com holds no liability for any investments made based on the information provided on this page. We strongly recommend independent research and/or consultation with a qualified professional before making any investment decisions.
coinmarketbuzz.com leverages advanced AI technology to analyze market data. All content is fact-checked and reviewed by our editorial team to ensure accuracy and neutrality.