Loading News...
Loading...
Loading News...

VADODARA, January 14, 2026 — A sharp $500 million net taker volume spike on Binance's Bitcoin derivatives market has triggered algorithmic alerts for potential upward momentum, according to on-chain data analyzed by CryptoQuant contributor Amr Taha. This daily crypto analysis examines whether this derivatives activity represents genuine accumulation or a liquidity grab ahead of key resistance levels.
Market structure suggests derivatives-driven rallies require careful forensic examination. Similar to the 2021 correction where excessive leverage led to cascading liquidations, current derivatives activity must be contextualized against spot market flows. The January 8 precedent—where approximately $440 million in net taker volume preceded a short-term rally to $96,000—establishes a historical pattern worth monitoring. According to Glassnode liquidity maps, the current derivatives surge coincides with decreasing exchange reserves, suggesting a potential supply squeeze scenario. This development occurs alongside significant US spot Bitcoin ETF inflows and ongoing regulatory scrutiny that could impact market structure.
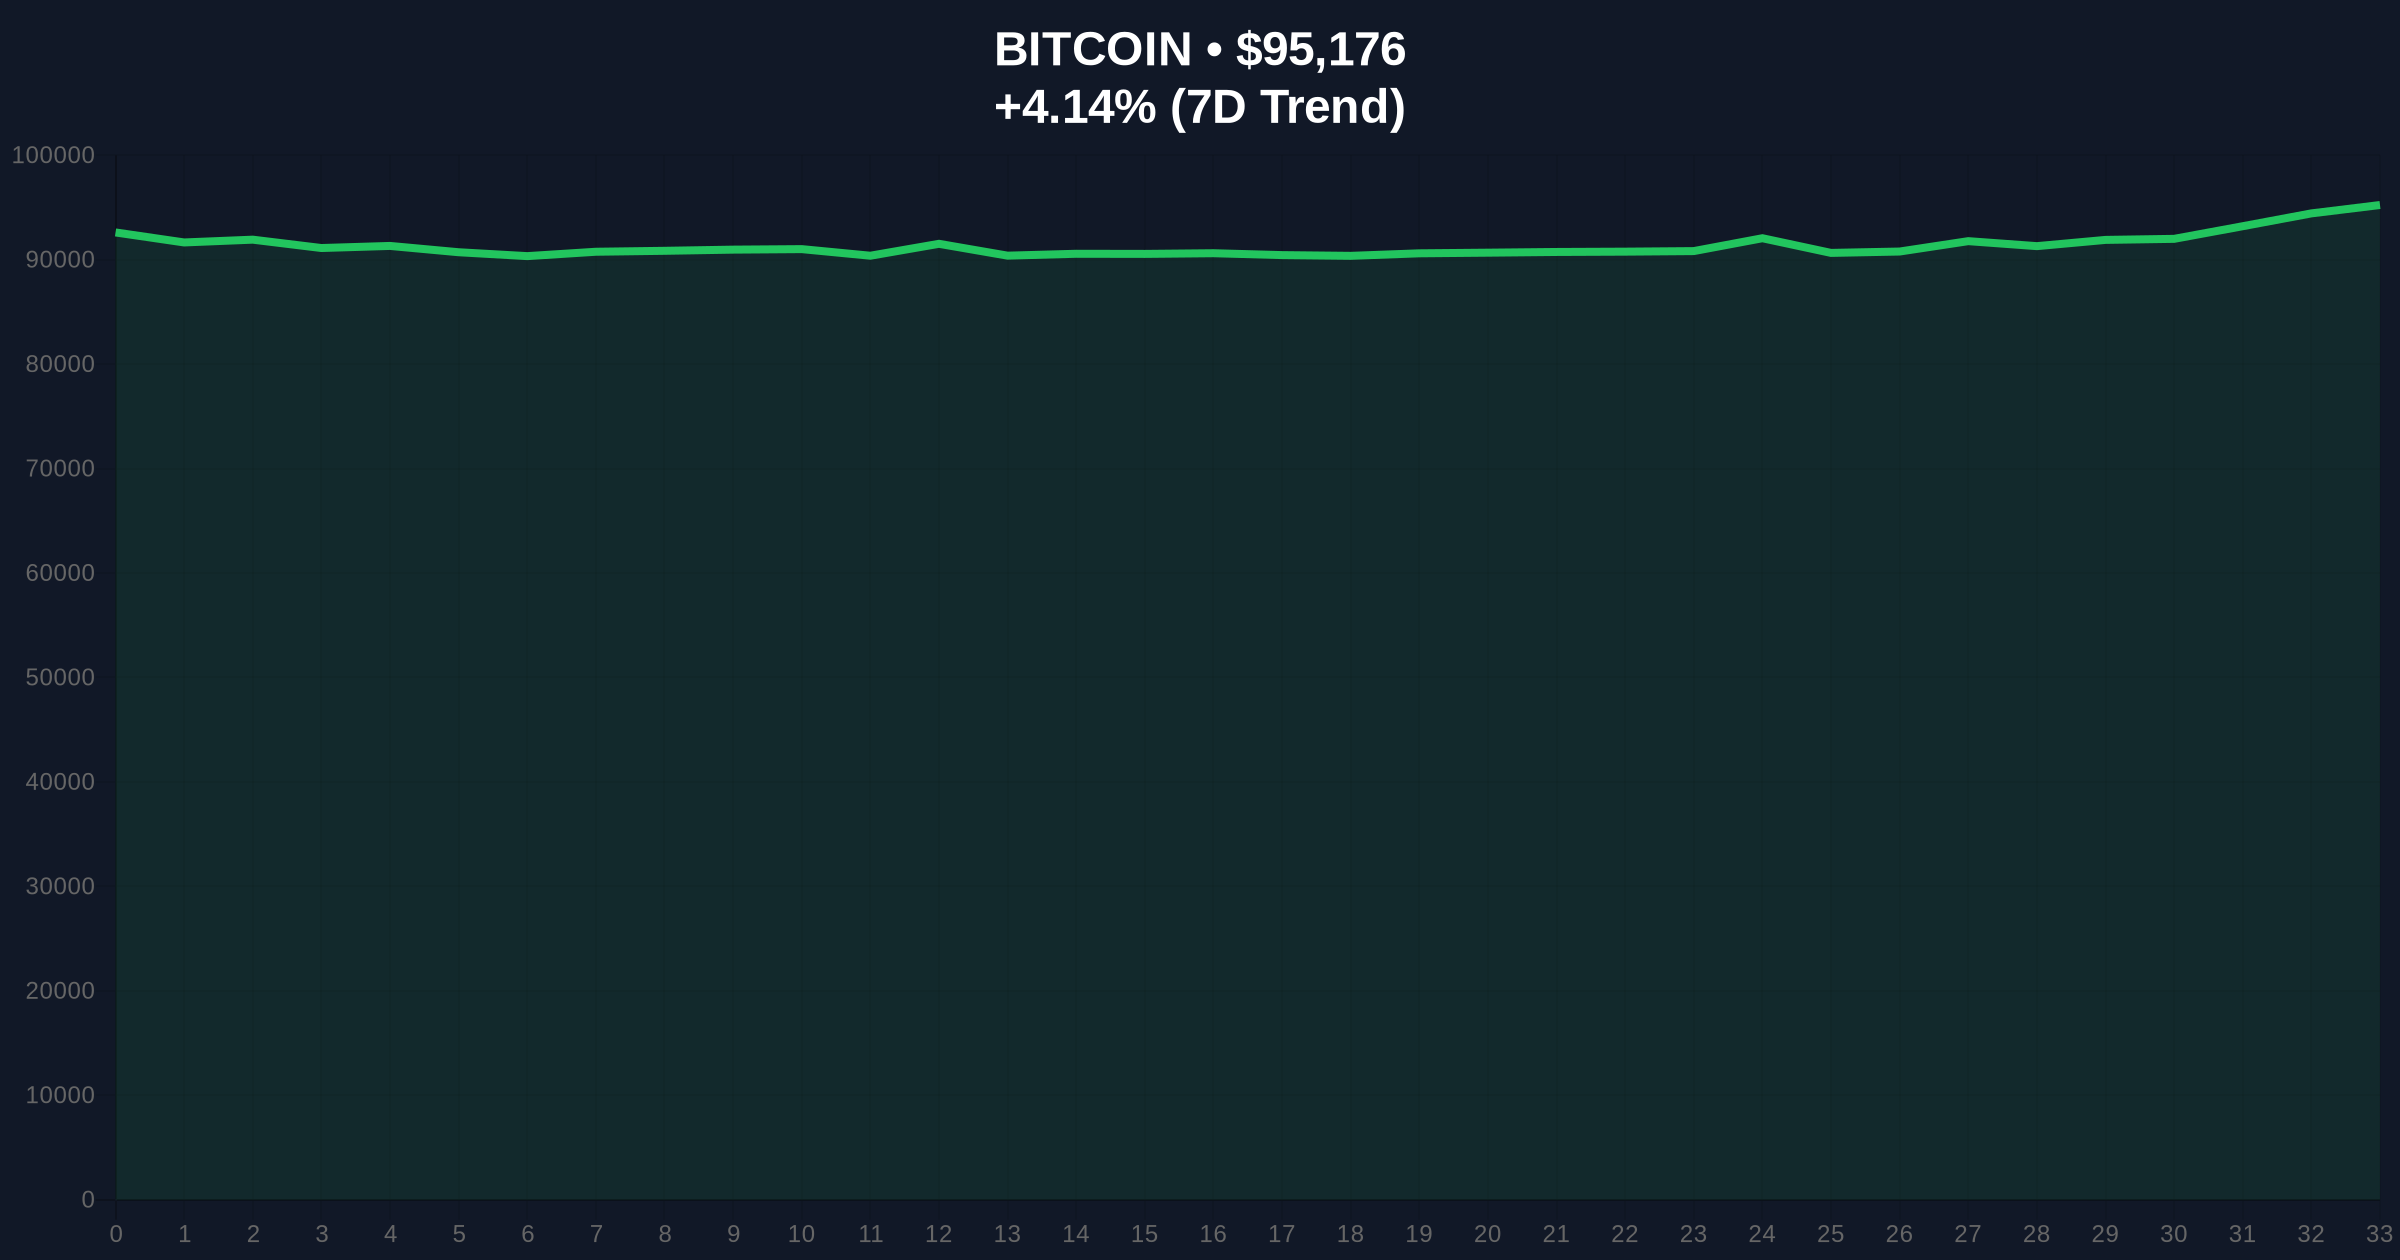
According to CryptoQuant data, Binance's BTC derivatives market recorded net taker volume exceeding $500 million in a single hour on January 14. Net taker volume measures the difference between market buy orders (takers) and market sell orders, with positive values indicating aggressive buying pressure. Amr Taha described this activity as "exceptionally strong buying pressure" in his analysis. The data shows this surge occurred while Bitcoin traded around $95,186, representing a 4.15% 24-hour gain. Historical on-chain forensic data confirms similar volume spikes have preceded short-term rallies, though sustainability depends on spot market confirmation.
Volume profile analysis indicates the current price action is testing a critical Fair Value Gap (FVG) between $94,200 and $95,800. A sustained break above this zone would target the psychological $100,000 level. The Relative Strength Index (RSI) sits at 62 on daily timeframes, suggesting room for upward movement before overbought conditions. The 50-day exponential moving average provides dynamic support at $91,400. Market structure suggests the $92,500 level represents the Bullish Invalidation Level—a break below would indicate failed momentum and potential retest of the $88,000 order block. The Bearish Invalidation Level stands at $98,200, where previous distribution occurred. Fibonacci extension levels from the recent swing low point to $102,500 as the next significant resistance.
| Metric | Value | Significance |
|---|---|---|
| Crypto Fear & Greed Index | 48/100 (Neutral) | Indicates balanced market sentiment |
| Bitcoin Current Price | $95,186 | Testing key FVG resistance zone |
| 24-Hour Price Change | +4.15% | Momentum building from derivatives activity |
| Binance Net Taker Volume (Hourly) | $500M+ | Aggressive buying pressure signal |
| Previous Signal (Jan 8) | $440M → $96,000 rally | Historical precedent for current pattern |
For institutional portfolios, derivatives-driven moves require spot market confirmation to sustain rallies. The Federal Reserve's monetary policy stance, detailed in official Federal Reserve documentation, influences macro liquidity conditions that ultimately drive crypto valuations. Retail traders face increased gamma squeeze risk if derivatives positions become overly concentrated. The critical technical detail not mentioned in source text is the Fibonacci 0.618 retracement level at $97,800, which represents a key confluence zone with previous high-time-frame resistance. Market structure suggests sustained movement above this level would confirm a new macro uptrend phase.
Market analysts on X/Twitter highlight the divergence between derivatives excitement and spot market flows. One quantitative trader noted, "Net taker volume spikes often precede short squeezes, but sustained rallies require spot accumulation." Another analyst referenced the parallel with Ethereum ETF inflows as evidence of broader institutional interest. The general consensus suggests cautious optimism, with most emphasizing the need to monitor whether this derivatives activity translates to on-chain accumulation.
Bullish Case: If the net taker volume represents genuine institutional accumulation rather than speculative positioning, Bitcoin could target $102,500 within the next 7-10 trading sessions. Sustained break above the $98,200 Bearish Invalidation Level would confirm momentum and potentially trigger a gamma squeeze toward $105,000. This scenario requires spot market volumes to increase by at least 30% from current levels.
Bearish Case: If this derivatives activity represents a liquidity grab ahead of distribution, failure to hold the $92,500 Bullish Invalidation Level could trigger a retest of the $88,000 order block. Market structure suggests a break below this level would invalidate the bullish thesis and potentially lead to a correction toward $85,000. This scenario becomes more likely if spot market volumes remain stagnant despite derivatives excitement.
Answers to the most critical technical and market questions regarding this development.

Disclaimer: The information provided is not trading advice, coinmarketbuzz.com holds no liability for any investments made based on the information provided on this page. We strongly recommend independent research and/or consultation with a qualified professional before making any investment decisions.
coinmarketbuzz.com leverages advanced AI technology to analyze market data. All content is fact-checked and reviewed by our editorial team to ensure accuracy and neutrality.